
October 2018, Vol. 245, No. 10
Corrosion Control
Effect of Acidity, Soil on Failure Probability in SAE-1018 Steel
By Román Olalde and Francisco Javier Rodríguez-Gómez, National Autonomous University of Mexico (UNAM), México City
In industries that use buried mild steel pipes for the transport of valuable fluids, it is essential to maintain their operation and efficiency, which can be achieved applying the measures of preventive and corrective maintenance required to extend their useful life.
However, the existence of a large number of pipes implies problems in the distribution of human, material and financial resources. A probabilistic tool that facilitates proper decision-making regarding resources is the probability of failure1 (PoF), which indicates which pipe might present a failure before the other pipes.

External corrosion2 is one of many threats affecting the integrity of buried pipes and is dependent on time. The primary exposure variables1 for a buried pipe are soil resistivity1,2 and pH1,2. Soil resistivity is a physical property that indicates how easily it permits the passing of an electric current. The soil pH is a chemical property that indicates which predominant ions (H+ or OH-) give the soil acidity, neutrality or alkalinity.
It is essential to know the corrosion kinetics of an SAE-1018 steel immersed in acid, neutral and alkaline media with low, moderate and high resistivity. This information help personnel involved in making the decision to obtain adequate distribution of the maintenance resources for buried pipes, as well as for generating data for other probabilistic models3 in ongoing development.
This article looks at the effect of soil pH and resistivity on the corrosion kinetics of a SAE-1018 steel using polarization curves4 and linear polarization resistance4 (LPR). The corrosion rate4 (CR) obtained is the primary entry data in the PoF calculated by normal distribution5.
Electrochemical Tests
A potentiostat and a typical three-electrode electrochemical test cell were used with a volume capacity of 150 cm3. The working electrode was SAE-1018 steel with an exposure area of 1.2667 cm2. The reference electrode was saturated calomel (SCE), and the counter-electrode was graphite. The working electrode was polished with 600 sand paper, washed with distilled water, degreased with acetone and stored in a desiccator before its use. The experiment was performed at room pressure and temperature (0.8 bar and 20° C) in Mexico City.
Electrolytes with resistivities6 of 30000, 3000 and 300 ohm-cm were used with pH values of 9, 7 and 4, yielding a total of nine different electrolytes. All of the experiments were performed three times to demonstrate the reproducibility of the results. As the experimental error of the series was minimal, only one datum is presented in each graph and table of the three obtained data.
The electrochemical tests were performed once the stationary state was reached. The condition of the stationary state was considered to be reached when the corrosion potential measured (Ecorr) changed less than 5 megavolts (mV) in a period of 30 minutes. The polarization curves were obtained at a sweep speed of 1 mVs-1, ranging from -500 mV to 500 mV. The Rp measurements were obtained at a sweep speed of 1 mVs-1, ranging from -20 mV to 20 mV.
Probability of Failure
The corrosion rate makes a buried mild steel pipe experience a decrease in the nominal thickness of the wall (t). This average decrease of thickness (μ) might be correlated to the required limit thickness “a” (X1 or X2) until before an immediate reparation, and with the standard deviation (σ) of the average decrease of thickness (μ).
In any probabilistic experiment5, two standardized variables Z1 and Z2 (Equations 1-2) are required, which are the intervals in which μ is evaluated with respect to time. From the results obtained in the electrochemical tests, nine CRs were used to determine an average decrease in thickness (μ), where a CR is subtracted from the nominal thickness of the wall (t) and Finally, the PoF is calculated, obtaining the Standardized Normal Distribution5 for Z1 and Z2 by means of the probability tables of a conventional spreadsheet software and the application of Equation3.
z1=x1−µσ [1]
z2=x2−µσ [2]
PoF=z2−z1 [3]
According to the API 5807, low PoF is between the values of 0.0001 and 0.001 events/year; below these values, it is a very low PoF. Moderate PoF is between the values of 0.001 and 0.01 events/year, and high PoF is all values higher than 0.01 events/year.
Results
Polarization Curves – In Figure 1, the results of the polarization curves of a SAE-1018 steel immersed in electrolytes with resistivities of 30000, 3000 and 300 ohm-cm are shown with pH values of 9, 7 and 4.
In Figure 1, a shift in the corrosion potential (Ecorr) is observed due to the exponential change of the electrolyte resistivity, and with the increase in the latter, the Ecorr becomes more positive. This resistivity also has an effect on the corrosion current density (icorr), and the effect is similar to the one observed with Ecorr.
Likewise, the effect of pH in the polarization curves provokes the Ecorr and icorr to change. The predominant reactions in this corrosion process are steel oxidation, water reduction in the case of neutral and basic media and hydrogen reduction in the case of acid media.
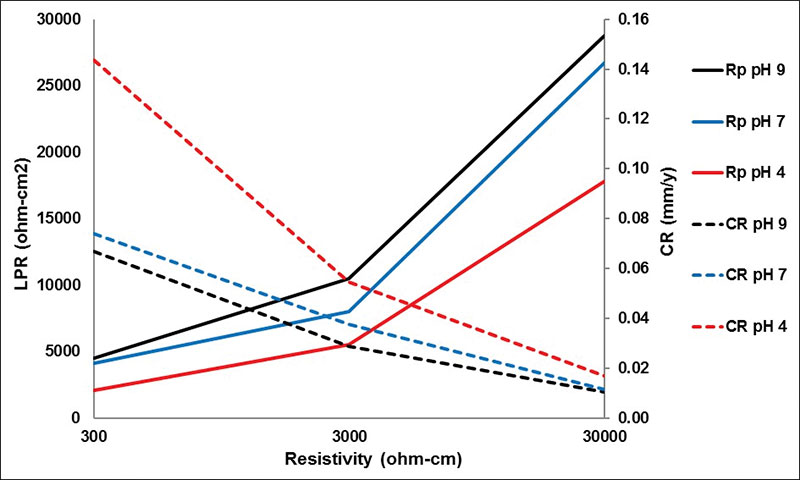
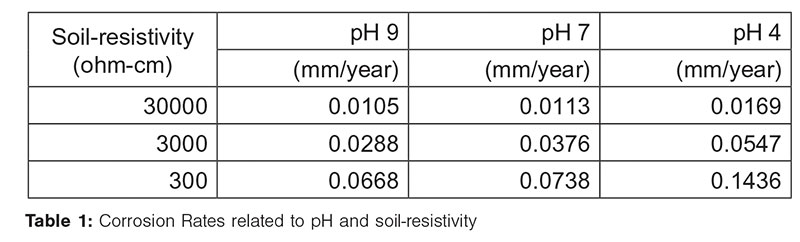
LPR and CRs – In Figure 2, the results of linear polarization resistance (LPR) evaluated in the nine electrolytes with the equivalent CRs are shown, and an increase in the LPR is observed due to the increase in the resistivity and pH. The most aggressive medium is the one with a resistivity of 300 ohm-cm and pH of 4, which fosters the transport of ions for a high CR compared to the other tests, as shown in Table 1.
Probability of Failure (PoF) – In Figure 3, the results of the PoF projections calculated with the nine CRs obtained by the electrochemical tests (Table 1) are shown, applying the Equations 1-3.
The high-resistivity electrolyte (30000 ohm-cm) produced a notably low PoF for SAE-1018 steel, according to the classification in API 5807. because of the difficulty of passing electric current through due to the high resistivity of electrolyte. The effect of pH was minimum and in any pH value, the PoF was kept very low in a 40-year projection range.
The moderate resistivity electrolyte (3000 ohm-cm) produced a PoF higher than the one obtained by 30000 ohm-cm for SAE-1018 steel, although even in these conditions, a notably low PoF was produced in neutral and alkaline media. However, in the acid medium, the proton had a considerable effect in the PoF, and from the 37-year projection, the PoF is moderate. For the year 39, it is high, according to the classification in API 5807.
The low-resistivity electrolyte (300 ohm-cm) produced three kinds of PoF for SAE-1018 steel, starting at low, moderate and high PoF, according to the classification in API 5807, which was due to the ease of passing electric current through due to the electrolyte’s low resistivity. The pH effect was fundamental to shorten the time to reach a high PoF from a low PoF; the high PoF was produced first in the acid medium in the year 15, later in the neutral medium in the year 29, and finally in the basic medium in the year 32.
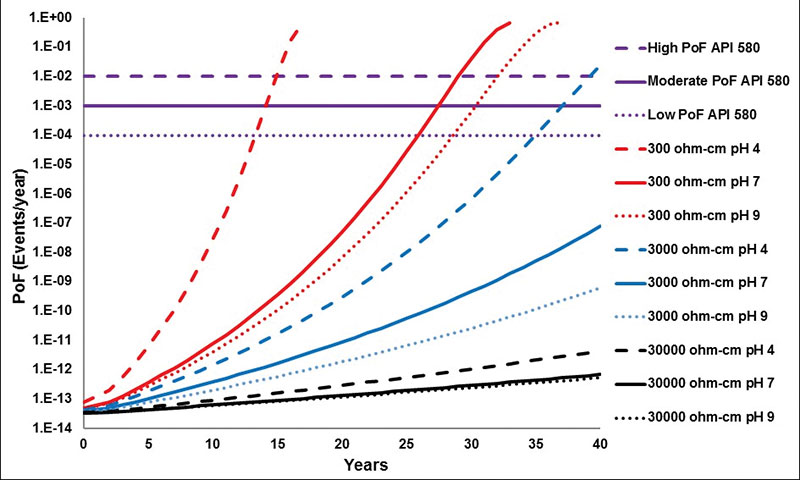
The three values of high PoF (at the 15, 29 and 32 years) are close to the remnant life (17, 32 and 36 years, respectively) limit, which validates the methodology employed in this work. It is important to mention that the PoF might decrease if any type of corrosion control is applied, such as the application of coatings and the use of cathodic protection, as well as from the design and installation, such as using higher thickness of steel.
Conclusions
The resistivity and pH of the electrolyte have a direct effect on the corrosion rate of SAE-1018 steel and its PoF. As the resistivity decreases, the CR and PoF increase; moreover, as the electrolyte is more acidic, the CR and PoF also increase.
The effect of the resistivity of the electrolyte on the CR and PoF is superior to the effect caused by the pH of the electrolyte. However, at the same resistivity, the CR and PoF tend to increase as the pH of the electrolyte decreases. The predominant reactions in this process are steel oxidation, water reduction and proton reduction.
It is recommended to people in charge of buried mild steel pipes that when there is a pipe in a low-resistivity soil and another pipe in an acid soil, priority of attention should be given to the former, as its PoF is higher. P&GJ
Acknowledgments: Román Olalde would like to thank CONACYT for providing a PhD scholarship grant.
References:
- W.K. Muhlbauer., Pipeline risk management manual, 3rd ed. Burlington, MA: ELSIVER 2004.
- A.W. Peabody., Control of pipeline corrosion, 2nd ed. Houston, TX: NACE 2001.
- W. Kent Muhlbauer, WKMC and DNV GL “Pipeline risk assessment the essential elements.” Pipeline and Gas Journal 241, 3 (2014).
- R.G. Kelly et all., Electrochemical Techniques In Corrosion Science and Engineering, 1st ed. New York, N.Y.: Marcel Dekker 2003.
- E. Walpole,, R. Myers and S. Myers., Probability and Statistics for Engineers, 6th ed. México, MX: Pearson 1999.
- ASTM G57 Standard Test Method for Field Measurement of Soil Resistivity Using the Wenner Four-Electrode Method, West Conshohocken, PA: ASTM 2012.
- API RP 580 Risk Based Inspection, Washington, D.C.: 2016.

Comments