
Cold Weather Leads to Near-Record Withdrawals from Underground Natural Gas Storage
Significant demand for natural gas in mid-February led to the second-largest reported withdrawal of natural gas from storage in the United States, according to the U.S. Energy Information Administration’s (EIA) Weekly Natural Gas Storage Report (WNGSR). Weekly stocks fell by 338 billion cubic feet (Bcf) in the week ending Feb. 19, nearly three times the average withdrawal for mid-February. A record amount of natural gas, 156 Bcf, was withdrawn during that week in the South Central region, which includes Texas.
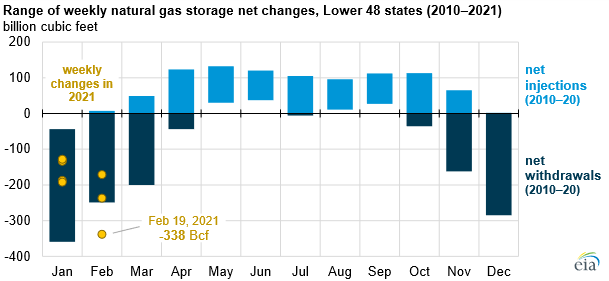
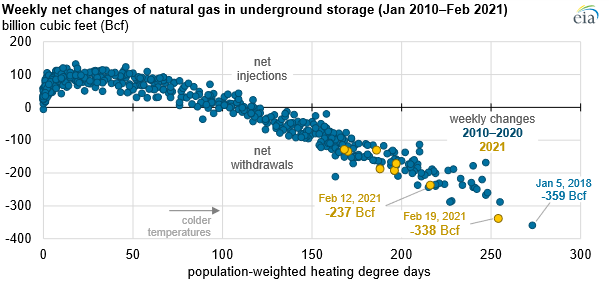
Colder-than-normal temperatures across much of the Lower 48 states, especially in Texas, led to increased demand for space heating. Population-weighted heating degree days (HDDs) represent temperature deviations lower than 65 degrees Fahrenheit and are weighted based on population distributions across the country. For the week ending Feb. 19, U.S. HDDs reached 254, or nearly 40% colder than normal, according to the National Oceanic and Atmospheric Administration.
In Texas, the two most common space heating fuels are electricity (the primary heating fuel in more than 60% of Texas homes, according to Census data) and natural gas (36%). Increases in electricity demand also affect natural gas demand because natural gas is the most prevalent electricity generation source in Texas and in much of the South.
Estimated U.S. natural gas demand on Feb. 14 reached 148.3 Bcf, surpassing the previous single-day record set in January 2019, according to estimates from IHS Markit. In addition, during the week ending February 19, U.S. average weekly dry natural gas production fell by 13.8 billion cubic feet per day (Bcf/d), according to estimates from IHS Markit. The decline in natural gas production was primarily because of freeze-offs, which occur when water and other liquids freeze at the wellhead or in natural gas gathering lines near production activities. Dry natural gas production fell by an estimated 10 Bcf/d in Texas alone, according to IHS Markit estimates.
Information in EIA’s Weekly Natural Gas Storage Report is also available on the Natural Gas Storage Dashboard, which shows natural gas inventories, storage capacity, prices, and consumption.
Related News
Related News

- Kinder Morgan Proposes 290-Mile Gas Pipeline Expansion Spanning Three States
- Enbridge Plans 86-Mile Pipeline Expansion, Bringing 850 Workers to Northern B.C.
- Intensity, Rainbow Energy to Build 344-Mile Gas Pipeline Across North Dakota
- U.S. Moves to Block Enterprise Products’ Exports to China Over Security Risk
- Court Ruling Allows MVP’s $500 Million Southgate Pipeline Extension to Proceed
- U.S. Pipeline Expansion to Add 99 Bcf/d, Mostly for LNG Export, Report Finds
- A Systematic Approach To Ensuring Pipeline Integrity
- 275-Mile Texas-to-Oklahoma Gas Pipeline Enters Open Season
- LNG Canada Start-Up Fails to Lift Gas Prices Amid Supply Glut
- TC Energy’s North Baja Pipeline Expansion Brings Mexico Closer to LNG Exports
Comments