U.S. Gas Production Hits Record High, Storage Still Trails
(P&GJ) — U.S. dry natural gas production reached a record-high 98.8 Bcf/d in September and significantly increased natural gas stocks but still fell short of average storage levels, the U.S. Energy Information Administration reported.
The record production contributed to September’s natural gas stock builds of 428 Bcf, which were 20% higher than the five-year (2017–2021) average. Despite the above-average builds, natural gas inventories at the end of the month were 3,135 Bcf, which is 8%, or 280 Bcf, below the five-year average.
U.S. LNG exports averaged 10.1 Bcf/d in September, as liquefaction terminals other than the off-line Freeport terminal operated near full capacity.
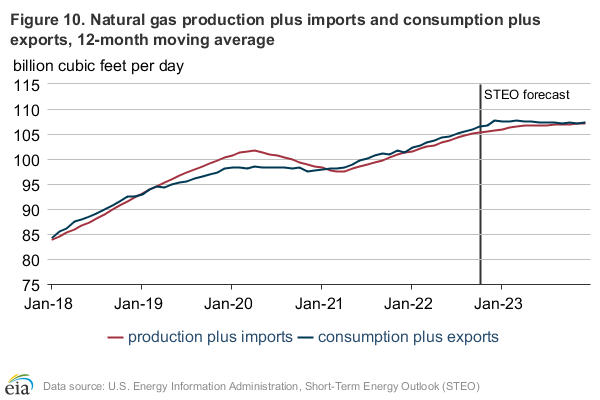
The 12-month rolling average of natural gas demand has exceeded supply since February 2021, which has contributed to an elevated Henry Hub spot price that doubled between June 2021 and July 2022. Monthly storage inventories have remained below the five-year average since June 2021, except for in December 2021, when unusually warm weather led to lower-than-normal storage withdrawals.
The EIA expects the Henry Hub spot price to remain elevated until the second quarter of 2023 when it forecasts the 12-month rolling average of supply to rise closer to average demand and inventories to rise above the five-year average.
As a result of higher forecast natural gas prices and consumption, EIA analysts expect households that use natural gas as their primary space heating fuel will spend 28% more this winter (October 2022 through March 2023) than they spent last winter. Nearly half of all U.S. households heat primarily with natural gas. We expect average household winter consumption to be 58 thousand cubic feet (Mcf), up 5% from last winter.
The EIA forecasts the Henry Hub spot price will start to decline in the first half of 2023 as producers continue to increase supply. In the first three quarters of 2022, U.S. dry natural gas production grew steadily. The EIA forecast that dry natural gas production to continue to increase, averaging 99.1 Bcf/d in 4Q22.
Natural gas futures contracts allow natural gas to be bought and sold for delivery at specific dates in the future corresponding to the start of each month. The natural gas 1st–13th month spread represents the difference between the price of natural gas sold for delivery 1 month from now compared to natural gas sold for delivery 13 months from now. The natural gas 1st–13th month price spread averaged $2.32/MMBtu in September, down nearly $1.13 from the record-high monthly average of $3.45/MMBtu set in August (Figure 11). The 1st–13th price spread has averaged over $2.00/MMBtu every month since April. During that time, natural gas prices have remained elevated, averaging $7.74/MMBtu, and natural gas inventories remained 8% or more below the five-year average.
When the 1st–13th price spread is positive, known as backwardation, near-term contract prices for the current month are higher than longer-dated contract prices for natural gas delivery one year further in the future. This difference reflects a market that puts greater value on natural gas sold for delivery one month from now compared with natural gas sold for delivery at the same time next year, encouraging market participants to sell natural gas from inventories instead of storing for future sales. Often, this situation occurs when natural gas demand is greater than supply, drawing inventories below the five-year range.
The high 1st–13th price spread since April 2022 reflects the highest annual natural gas demand on record, driven by the electric power sector and high LNG export levels. High demand is keeping inventories at a deficit to the five-year average. Dry natural gas production has increased since April but not by enough to significantly reduce the storage deficit to the five-year average. As a result, the 1st–13th price spread has remained at its highest monthly levels on record.
EIA analysts expect natural gas spot prices to remain elevated in late 2022 before falling in 2023. They forecast the Henry Hub spot price to average about $7.40/MMBtu in 4Q22, then fall below $6.00/MMBtu in 2023 as U.S. natural gas production rises.
Related News
Related News

- Kinder Morgan Proposes 290-Mile Gas Pipeline Expansion Spanning Three States
- Valero Plans to Shut California Refinery, Takes $1.1 Billion Hit
- Three Killed, Two Injured in Accident at LNG Construction Site in Texas
- Tallgrass to Build New Permian-to-Rockies Pipeline, Targets 2028 Startup with 2.4 Bcf Capacity
- TC Energy Approves $900 Million Northwoods Pipeline Expansion for U.S. Midwest
- U.S. Pipeline Expansion to Add 99 Bcf/d, Mostly for LNG Export, Report Finds
- Enbridge Adds Turboexpanders at Pipeline Sites to Power Data Centers in Canada, Pennsylvania
- Great Basin Gas Expansion Draws Strong Shipper Demand in Northern Nevada
- US Poised to Become Net Exporter of Crude Oil in 2023
- EIG’s MidOcean Energy Acquires 20% Stake in Peru LNG, Including 254-Mile Pipeline


Comments