
U.S. Dominates Global Natural Gas Production and LNG Exports
(P&GJ) — According to Forbes, the Energy Institute's June 2024 Statistical Review of World Energy provides a detailed analysis of global energy dynamics. The review indicates that in 2023, the demand for natural gas increased slightly by 1 billion cubic meters (Bcm), equating to a 0.02% rise, which just edged past pre-pandemic figures from 2019.
While natural gas maintained a 29% share of global fossil fuel use, its overall contribution to primary energy consumption has decreased by 0.5% since 2019.
The production of natural gas worldwide remained stable compared to the previous year, with the U.S. maintaining its position as the leading producer, contributing around 25% of global output. Europe saw a production drop of about 7%, and Russia's production fell by 5%. The four major production regions, which together account for 80% of global production, are also responsible for 85% of its consumption.
Prices for natural gas have dropped significantly. In Europe and Asia, prices fell by 30% from 2022's peak, averaging $13/mmBtu. In the U.S., Henry Hub prices plummeted by 60%, reaching an average of $2.5/mmBtu, returning to pre-pandemic levels.
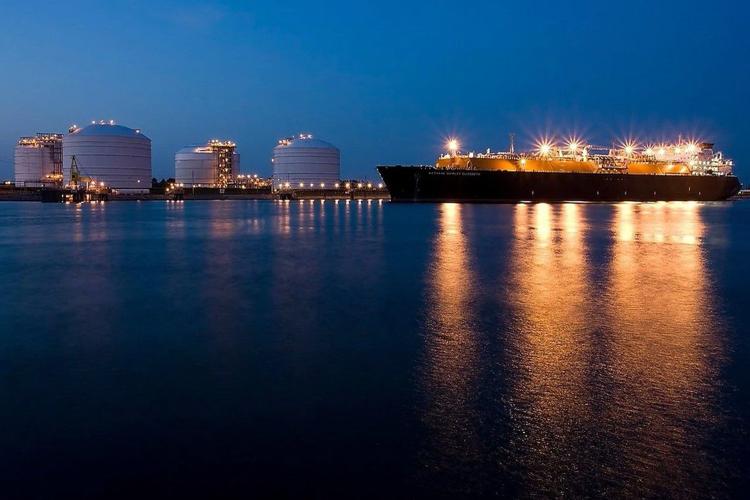
Russia's share of gas imports to the European Union has diminished from 45% in 2021 to just 15% in 2023, trailing Norway and the U.S. The supply of liquefied natural gas (LNG) increased by nearly 2% (10 Bcm) to 549 Bcm in 2023. The U.S. has surged ahead as the top LNG exporter, with its exports rising from 0.2 Bcm in 2013 to 114 Bcm in 2023, surpassing Qatar and Australia. U.S. supply grew by nearly 10%, whereas Qatar's decreased by 2%. Russia faced reductions in both LNG and pipeline exports, with LNG down by 2% (0.8 Bcm) and pipeline exports falling by about 24% (30 Bcm).
LNG demand in the Asia Pacific region, notably from China, India, and other non-OECD countries, led to an overall increase of 11 Bcm, 2.6 Bcm, and 7.6 Bcm, respectively. Conversely, Europe and OECD Asia Pacific saw declines in LNG imports of 3 Bcm and 11 Bcm, respectively.
According to Forbes, China has regained its status as the largest LNG importer, followed by Japan and South Korea, which together account for roughly 45% of global LNG trade. Overall, net pipeline trade of natural gas fell by about 8% (35 Bcm) in 2023, with European imports dropping by 26% (40 Bcm) largely due to a 91% reduction in Russian supplies.
The United States remains the top natural gas producer, with a 25.5% share of global production in 2023, strengthening its lead over Russia and Iran, Forbes data showed. The rankings among the top 10 producers have seen some shifts, with China making notable gains and potentially challenging Iran’s third position.
In terms of consumption, the U.S. continues to lead significantly, with a modest 0.8% increase from 2022. The top 10 consumers have seen notable changes, with Mexico and China rising sharply, while the UK has dropped off the list, replaced by the UAE.
In summary, the 2024 review highlights a slight uptick in global natural gas demand as the market recovers from the pandemic. The U.S. remains a dominant force in both production and LNG exports, while Europe's reduced demand and production, along with declining Russian imports, signify major shifts in the regional energy landscape.
Related News
Related News

- Kinder Morgan Proposes 290-Mile Gas Pipeline Expansion Spanning Three States
- Enbridge Plans 86-Mile Pipeline Expansion, Bringing 850 Workers to Northern B.C.
- Intensity, Rainbow Energy to Build 344-Mile Gas Pipeline Across North Dakota
- U.S. Moves to Block Enterprise Products’ Exports to China Over Security Risk
- Court Ruling Allows MVP’s $500 Million Southgate Pipeline Extension to Proceed
- U.S. Pipeline Expansion to Add 99 Bcf/d, Mostly for LNG Export, Report Finds
- A Systematic Approach To Ensuring Pipeline Integrity
- 275-Mile Texas-to-Oklahoma Gas Pipeline Enters Open Season
- LNG Canada Start-Up Fails to Lift Gas Prices Amid Supply Glut
- TC Energy’s North Baja Pipeline Expansion Brings Mexico Closer to LNG Exports
Comments