March 2012, Vol. 239 No. 3
Features
GIS-based Risk Analysis Simplifies Assessment Process

Risk identification and assessment are essential for effective pipeline safety and integrity management. Using risk and/or likelihood of failure evaluation, pipelines are prioritized for physical assessment and for implementation of preventive and mitigative measures. From a facility operations perspective, risk quantification can provide important information for effectively allocating limited resources.
The risk-analysis process is data-intensive. Substantial information is required to describe the pipeline facility, its construction, its operation, and the environment through which it is routed. Numerous options exist for collection, storage, management, and maintenance of this data. The geographic information system (GIS) is an excellent choice for the job because it is designed to store, manage, and analyze large volumes of spatial information such as are associated with pipeline systems.
Many risk solutions available on the market utilize proprietary, non-GIS oriented data management approaches with options for importing data from commonly available GIS systems. This data import process can be time-consuming and may introduce errors or require additional processing steps. More time and effort is spent on data translation with less left for risk analysis. To avoid potential problems in this area, NiSource Gas Transmission and Storage (NGT&S) has decided on an approach that fully integrates the risk assessment process with its GIS.
The NGT&S gas transmission system consists of more than 15,000 miles of pipeline in locations ranging from New York state to the Gulf Coast. A significant portion of the system is long-haul pipeline, in which hundreds of miles of pipeline were constructed using similar materials and construction practices. These lines typically have common characteristics and threats (e.g., age, material, coating and vintage construction practices). There are often multiple pipelines in the same right-of-way and most of the lines are 100% piggable, providing reasonably good data on the current state of the line.
However, a substantial portion of the system includes pipe with little commonality and presenting a greater challenge for risk management. These areas of the system often have unique characteristics and threats with little standardization. Most of these lines are not capable of being inspected with inline tools (pigs), and the ability to obtain data on the health of the pipeline is limited. These lines typically feed towns or small cities or connect to underground gas storage areas.
Pipeline risk is commonly defined as the Likelihood of Failure multiplied by the Consequence of Failure. Likelihood is a measure of threats to the pipeline while Consequence is typically the impact of a failure on public safety, with additional considerations of the environment or the business. For many years the management of risk on NGT&S pipelines was driven by resource allocation and boiled down to who could do the best job of describing why their project was most important to the company’s future. There was minimal definitive basis for objective, risk- based decision making regarding system integrity projects.
The first real effort at effective risk management began in the 1990s. It consisted of pre-determined, relevant (but still generic) questions that were asked of each project, such as: 1) Is the project required by regulation? 2) Does it improve public and/or employee safety? 3) Does it improve system reliability? 4) Does it improve the company’s bottom line?
This change broke up the “big story” into smaller parts that could be more easily examined. It represented the first attempt at finding a common basis for evaluating large projects.
In 2002, federal regulations came into effect requiring companies to develop a systematic and well-reasoned program for risk assessment and integrity management. Pipeline operators were required to identify “High Consequence Areas” (HCAs) along their systems. These are locations where a failure would have the greatest impact on public safety. The threats applicable to pipelines within HCAs were to be identified, with regular assessments for these threats. Within the regulation, timelines for the execution of these activities are specified.
Following the issuance of the regulations, the company’s subject matter experts (SMEs) developed a Data Element Spreadsheet. This was a list of 104 questions about threats to facilities in HCAs. At that time, NGT&S identified approximately 1,000 HCAs in the system, thus requiring 104,000 questions to be asked and answered. Though considerable information about risk and threats to the pipeline system was gathered, the process was extremely time-consuming, was difficult to update, worked with “worst case in a given area” rather than actual data, and did not significantly consider facilities outside of the HCAs. But the company finally had a uniform process for evaluating risk across the HCAs of the system.
NGT&S believes that integrity management is more than just meeting regulatory requirements. In fact, the company believes that optimal integrity management practices lead substantially to regulatory compliance.
An external data processing approach to risk evaluation was initiated in the 2006-2008 time period. It involved the extraction of relevant data from multiple information systems across the company. The data was then processed in a consultant’s proprietary system outside the company’s GIS. This approach provided the opportunity to leverage the company’s existing information resources to obtain a more detailed view of risk across the company’s transmission pipeline network.
For the first time, the process of “Dynamic Segmentation” was available to enable analysts to explore risk at the highest spatial resolution possible. Dynamic Segmentation is an automated process that provides the ability to review changes in pipeline data attributes at high resolution (sub-foot in some cases). This risk approach had both advantages and disadvantages:
* Advantages were: 1) dynamic segmentation enabled use of high-resolution data, 2) risk analysis extended beyond HCAs, 3) the operator had a valuable opportunity to work with knowledgeable experts, 4) areas where data was weak were readily identified and 5) confidence in our original (104 questions) results was reinforced.
* Disadvantages were: 1) lack of uniform data alignment in existing systems caused substantial problems, 2) process for dealing with data quality issues was cumbersome, 3) extensive development of complex default data rules was required and 4) extra data handling increased the chances for errors.
In retrospect, we may have tried to do too much, based on the quality of data available at that time.
2009-Present GIS-based Processing
Development of a GIS-based risk analysis capability was started in 2009. This has proven to be the most successful platform for system-wide risk evaluation. GIS technology has been in use at NGT&S since the 1990s. It holds a wealth of information on the company’s pipeline assets including facility details, operating parameters, inspection results, and surrounding environmental/cultural conditions.
The risk-analysis solution was designed from the ground up around the data and spatial analysis capabilities available within the company’s enterprise GIS system. At the same time, NGT&S personnel took the opportunity to make substantial improvements in the GIS system and data. The success of the current risk approach is due in great part to the efforts of our GIS personnel. As with the previous solution, it should be noted that there are advantages and disadvantages:
* Advantages are: 1) flexibility – NGT&S controls software functions and resulting solution capabilities, thereby allowing for the greatest degree of flexibility; 2) requires no data translation – operates directly against GIS database; 3) readily available spatial analysis functions increase the processing capabilities of the solution such as a) processing of key datasets (such as inline inspection anomaly data and habitable structures) is eased due to availability of GIS-based tools and b) GIS-based dynamic segmentation provides results at highest resolution possible; 4) “Open” data solution provides flexible access to other data sources, such as a) other company sources, b) third-party data (e.g., RexTag, ESRI data appliance), and c) public domain data sources (e.g., FEMA flood, National Highway Performance Monitoring System).
* Disadvantages are: 1) flexibility – it is so easy to make changes that the change process must be orderly and controlled – or changes in risk results will be difficult to interpret (suggest once a year updates to algorithm be made along with archiving of results archiving); 2) GIS expertise is required to work through issues that may arise (the NGT&S set-up works well – an engineer familiar with pipeline threats plus a GIS expert (Company/Consultant/Both); 3) end-user tools not yet readily available within GIS, such as custom reporting, Web access, scenario development, etc. (we are using a third-party end user solution, with expected integration challenges).
Risk Determination
The general work flow for development of risk results involves the execution of procedures that summarize relevant information across each pipeline:
1. The effect of various combinations of facility and operations data on risk;
2. The information provided by various survey methods used along the pipeline (such as inline inspection, patrols, and cathodic protection surveys);
3. Impact of various environmental factors such as floods, ground stability, earthquakes;
4. The contribution of cultural features encroaching on the pipeline (such as other company pipelines, electric transmission lines, transportation features);
5. The contribution of historic data on leaks, incidents, anomalies, etc. to risk; and
6. Potential failure impact on surrounding population and facilities (consequence of failure).
Close to 100 data attributes are considered in the risk calculation for each segment (a segment is created any time any of the attributes change along the pipeline). Utilizing this information, a value is calculated for each threat to the pipeline. The threat factors considered include external corrosion, internal corrosion, mechanical damage (accidental or intentional strike of the pipe), construction-related, weather and outside forces (earthquake, landslide, etc.), manufacturing and materials-related, equipment failure, incorrect operations, and stress corrosion cracking.
Subsequent calculations are then performed for consequence, total likelihood of failure, and total risk. Total likelihood of failure is the sum of all the threat factors, while total risk is the total probability of failure multiplied by the consequence factor. Following are several examples of the processing utilized to attain the final risk result.
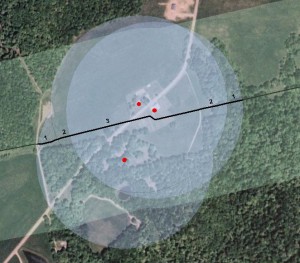
Figure 2: Structure Unit Counts.
Structure unit counts are a factor in the determination of consequence of failure. In Figure 2, the potential impact radius (PIR) buffer appears in light green paralleling the black pipeline. The PIR is a measure of the distance from the pipeline that could be damaged in the case of a failure. It is derived from the outside diameter of the line and the maximum allowable operating pressure. In the above case, the numbers along the pipeline indicate the number of structures for human occupancy that could potentially be impacted in the case of a failure.
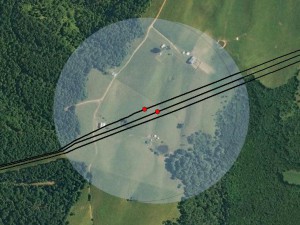
Figure 3: Unauthorized Encroachments.
Unauthorized encroachments near the pipeline are an indicator of potential mechanical damage to the pipeline and a possible lack of public awareness. In Figure 3, two ROW encroachments have been identified that could impact the sections of pipeline overlaid by the circles. Using the spatial analysis functions available within the GIS, we are able to identify the location of the encroachments and the sections of pipeline that should be assigned an increased risk score.
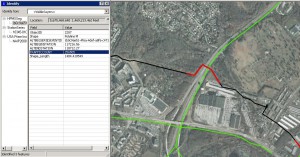
Figure 4: Proximity to Busy Highways.
The U.S. DOT maintains the Highway Performance Monitoring System (HPMS), a national level highway information system that includes data on location, condition, performance, use, and operating conditions of the nation’s highways. Included in the data is “average annual daily traffic” count which is a measure of the number of automobiles utilizing a section of road on a daily basis.
As an input to the consequence factor, we identified all sections of roadway from the HPMS that fall within the Potential Impact Radius of a pipeline and calculated an impact factor based on the magnitude of the traffic count. Figure 4 identifies the section of pipe (in red) that could impact the busy highway (in green). The “Identify” listing indicates that the traffic count in that area is 256,505 vehicles per day on average. Although not required by regulation, NGT&S uses this data to adjust the consequence calculation.
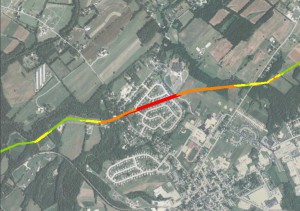
Figure 5: Habitable Structure Density.
In Figure 5, the colors used indicate risk level along the pipeline. Green signifies lowest risk, followed by yellow, orange and red indicating escalating levels of risk. It can be seen that as the pipelines cross areas of high habitable structure density, there is a spike in the risk level due, in this case, to a sharp rise in the consequence factor. The pipe and other factors in this section remain relatively consistent.
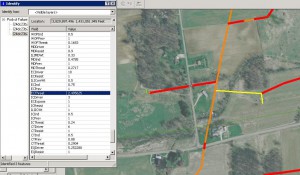
Figure 6: External and Internal Corrosion.
In Figure 6, the same color scheme as in Figure 5 indicates level of risk. The somewhat horizontal (red) line near the center is a potential risk due to a high score on both the external and internal corrosion threats. This is due to two primary factors – a casing is present at the location where the pipe crosses the road and the lines in this area carry gas to and from gas storage facilities. Casings may be associated with an increased risk of external corrosion due to the propensity for moisture to become trapped between the carrier pipe and the inside of the casing, and the difficulty in protecting the pipe cathodically. In addition, higher levels of moisture in the gas stream are typically associated with underground storage, increasing the likelihood of internal corrosion for the pipelines serving those facilities.
In conclusion, NGT&S has experienced an evolution in the assessment of risk to its pipeline assets. Over time, the methodologies employed have improved to take advantage of engineering research related to threats to the pipeline, better pipeline inspection methodologies, better data collection and storage capabilities, and increases in data accuracy and spatial resolution of the data. The company’s development of an enterprise GIS has led to much better consolidation and standardization of critical data on the pipeline assets. In addition, the GIS provides powerful spatial analysis tools that allow risk management specialists to better understand and model the complex spatial relationships and interactions that contribute to individual threats and overall risk.
Authors
Dave Adler is principal engineer – system integrity, NiSource Gas Transmission and Storage. He is responsible for supporting the highest level of public safety in areas near the firm’s pipelines and related facilities. He also supports system reliability and is specifically responsible for identification and assessment of diverse threats to the system such as mechanical (third-party) damage, corrosion and equipment issues. He can be reached at dadler@nisource.com.
John Beets is principal GIS technologist,Willbros Engineering. He provides direction for incorporation of GIS technology into all aspects of the pipeline life cycle including planning, construction, operations, and maintenance. He plays a major role in determining spatial data management strategies to address pipeline integrity management requirements, including risk analysis. He can be reached at john.beets@willbros.com.


Comments