July 2013, Vol. 240 No. 7
Features
The Portable Clamp-On Ultrasonic Meter: A Tool For Gas Pipeline Operators

The increasing rate of natural gas users and higher gas prices in Colombia has created the need of considering better, more accurate measurement alternatives to reduce the uncertainty of calculated volumes in customer natural gas stations where a fiscal custody transfer system is not available.
As known, commonly these technologies are used for transmission measurement:
• DP Flow Meters (AGA 3)
• Turbine Flow Meters (AGA 7)
• Rotary-Type Gas Displacement (ANSI B109.3)
• Diaphragm Flow Meters (NTC 2728)
• Ultrasonic Flow Meters (AGA 9)
• Coriolis Flow Meters (AGA 11)
Promigas is a Colombian natural gas transmission company that delivers gas at 330 points on a daily basis. During the last year, 85% was consumed by industries and gas-fired power plants. To estimate and calculate gas volumes, Promigas follows best practices such as the American Gas Association reports, Normas Técnicas Colombianas (NTC) and ANSI Standards Recommendations. This wide variety of reports and flow meters implies the use of state-of-the-art technologies and application of statistical techniques, not only for gas volumes calculations but the Lost and Unaccounted for Gas (LAUF).
Most of the efforts to supervise and control imbalances in gas pipeline systems – during a certain period – are focused on the reliability of measurement systems, including SCADA availability; in fact, the time of unavailability plays an important role in gas calculations.
Although most customer gas stations have meter by-pass systems or sometimes spools are installed to avoid interrupting service continuity, they do not have in most cases backup flow meters to quantify the gas volumes. It is important to note that in Colombia it is not mandatory to use backup meters on delivery stations. It’s a common practice and a fiscal requirement in some European countries to have two custody transfer meters of different types on the same line. The cost of having backup flow meters can be considerable if they are going to be used as a fiscal custody transfer meter. At this point, as mentioned earlier, the use of another measurement alternative (flow meter or statistical techniques) becomes necessary.
Contracts between Promigas and its customers include a clause in which there are four different ways of calculating gas volumes when fiscal custody transfer system is not reliable:
Despite having these gas calculation alternatives, occasionally mathematical procedures do not produce suitable results, mostly related to unscheduled deviations from historical consumption reported by clients, and one of the direct consecuences is the noticeable differences in gas balance results at month´s-end closing process.
A market research identified Clamp-On ultrasonic technology, which has been widely used in the water, liquid and gas industries, as a tool for addresing the abovementioned contingencies. This articler provides a brief description of how Promigas has been using the GE Clamp-On ultrasonic meter to calculate volumes effectively delivered at gas stations.
Test Cases

Two customer gas stations with the following operating conditions were selected to illustrate performance of the Clamp-On:
Station 1
The turbine used for custody transfer was scheduled to be calibrated at the Promigas Calibration Facility, which is part of the Promigas Metrology Lab and is a unique facility in South America capable of performing metrological tests to flow meters with natural gas at high pressure.
An alternate measurement system was necessary during the calibration test (four days); Clamp-On USM was set up and installed at this location. The first challenge was finding a site with the minimum requirements of straight-run pipe. According to the manual, the location of the transducer measurement point must be located with 20D (nominal pipe diameter) of upstream straight-run pipe and 10D downstream straight-run pipe. In addition, the point should be at least 10D from any butt welds or flanges. The reason why we called it a challenge is because usually gas stations are built strictly with the resources (pipeline, instruments, filters, etc.) in order to be more economically feasible. Figure 1 and 2 illustrates an isometric view of the station and the place where the Clamp-On USM was installed.

In this case, the turbine meter was going to be calibrated and two blind flanges installed so the natural gas could flow though the bypass system. The Clamp-On was not located at the bypass system because there were some instruments, like the axial flow regulator valves, which could produce noise signal in a frequency that affected the portable USM.
In fact, the Clamp-On was first installed in the bypass but some sort of interference was identified by the USM as E4 (signal quality problem). The Clamp-On USM was installed on a vertical pipe with a 3-inch nominal diameter. The user manual recommends installing the transducers at 180° on opposite sides of the pipe in a horizontal plane; however, it also states that additional pipe surveys may provide information that can lead to modifications for optimal installation.
Data Analysis Station 1
As mentioned before, the measurement system was dismounted and there was no telemetry (SCADA) information on pressure, temperature, and other variables at the station. However, there were other nearby locations to monitor the variables. Gas volume information was recorded by the Clamp-On in uncorrected volume conditions (ft3). In order to convert volumes to base conditions, it is necessary to at least have the pressure and temperature data for a rough calculation. For pressure, information for five days prior to the calibration was taken for forecasting. Figure 3 illustrates the behavior of pressure in the system before being regulated at STATION 1 for a period of five days and a forecast of one day.
As shown in Figure 3, the behavior of the pressure is seasonal and it can be forecasted with statistical methods. There are many Time-Series Forecasting Methods for seasonal data behavior. In this case, the data are seasonal but with no trend and the Additive Seasonality Forecasting Technique can be used (parameters ?=0.8294, ?=0.9990). The forecast was done using Crystal Ball Predictor software.

The average deviation between real values and forecasted values was 1.2%, giving a suitable approach to the real values. An average for the same time period was used for the temperature to be used. Figure 4 shows the trend between the Clamp-On USM and the turbine meter after the calibration, and the results were satisfactory overall (average hourly differences: 1.3 ft3/h). A correlation factor that represents the difference between both measurements systems was applied to the volumes recorded by the Clamp-On meter.

Station 2
The following case is a performance comparison between the DP-Flow meter device and the Clamp-On. At this location, the minimum requirements of straight-run pipe were available. Figure 5 illustrates the place where the device was installed and the direction of gas flow.

A black plastic covering was used due to the changing climate conditions (too much rainfall at night). It is important to notethat a regulated pressure and temperature values were fixed at this station in the Clamp-On settings for flow rate estimations and in situ comparisons.
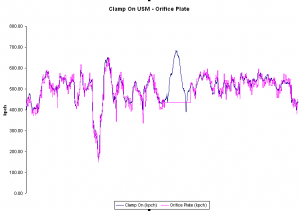
After four days of data recording, Figure 6 shows the gas flow trend between both gas measurement systems. There is a short interruption in the SCADA continuity and a straight red line shows this event.

• Recording time: four days
• Data recording interval: 60 seconds
• Units: MMSCFH
• Average pressure: 350 psig
• Average Temperature: 84 °F
Conclusions
Using the portable Clamp-On ultrasonic meter in different applications corroborated its versatility, recognizing the limitations that establish the minimum requirements for installation and metrological performance.
In Promigas this equipment has been used successfully to determine the consumption of customers in the absence of custody transfer system during maintenance, calibration or failures. Additionally, this technique has been applied to verify measuring flow patterns in gas delivery stations in order to identify performance problems or disturbances on site promptly.
Our customers have accepted the results of these measurements, reaffirming its validity as a useful tool for gas pipeline operators globally.
Authors
Carlos J. Castaño has worked for Promigas since 2002 and holds degrees in Mechanical Engineering and Projects Management from Universidad del Norte. Among his responsibilities are control of lost-and-unaccounted-for gas, operation of measurement devices and controller training programs. He is certified as an Operations and Maintenance Instructor by the National Center for Construction, Education and Research (NCCER). As a Promigas employee he has been leading projects of OQ Rule, Online Simulation, Controllers’ Training and BCM.
Jorge L. Navarro is a gas controller who graduated as an industrial engineer from Universidad del Norte and has worked for Promigas since 2009. His experience includes gas balancing and among his responsibilities are estimating customer’s gas volumes using best statistical methods and the administration of the integrated gas platform software used by internal and external users (NTGAS 2.0).


Comments