
December 2014, Vol. 241, No. 12
Features
How LDCs Performed During Nations Coldest Winter In 29 Years
America’s natural gas utilities work with federal and state regulators to build and maintain a 21st century infrastructure capable of safely and reliably delivering natural gas to homes and business throughout the United States.
Since 1990, natural gas utilities have installed modern plastic pipes used for delivering gas at low pressure at a rate of 30,000 miles per year, and cathodically protected steel mains used for high-pressure delivery at a rate of 1,500 miles per year, both connecting new customers and upgrading existing pipeline infrastructure. Natural gas emissions from utility-owned distribution systems dropped 17% during that time period and nearly 90% of those emissions declines are due to pipeline replacements.
To determine the readiness of the nation’s distribution companies to deal with peak consumption periods, an American Gas Association (AGA) study conducted in 2012 found that:
- For at least the next decade, domestic natural gas supplies are expected to remain sufficiently robust to meet substantial growth across all gas demand sectors
- The strong natural gas supply position, coupled with a growing and viable delivery infrastructure, promises the nation an affordable energy that can fuel economic recovery, while protecting the environment.
Two years after the study was released, this vision was tested by the second-coldest winter in the United States since 1985. The weather event – a polar vortex – affected large swaths of the country and pushed the natural gas market to unprecedented performance levels.
AGA said the natural gas industry responded collectively to this historic weather event by implementing strategies, based on decades of operational experience. In particular, LDCs were prepared and met the challenge by executing plans made for just such contingencies.
Supporting this is the recently released AGA study, Promise Delivered that focuses on the planning, preparation and performance of the nation’s LDCs during the 2013-2014 winter heating season (WHS), which is defined as November 2013 through March 2014.
The study is based on the findings from five AGA papers and other data. These papers cover LDC gas supply portfolio planning, the contribution of underground storage, the role of interruptible customers, energy efficiency developments, and the statistical case for an extraordinary winter. Also included is a report focusing on market conditions over the past decade, which set the stage for the industry’s remarkable performance this past winter.
Certainly one of the most valuable aspects of the study can be found in the findings, observations and conclusions section. The Promise Delivered report also includes an analysis from data acquired from AGA member LDCs through the Winter Heating Season Performance Survey.
AGA received responses from 84 LDCs with service territories in 49 states.
Some highlights of the report:
Natural Gas Consumption
The report notes that more customers were served with larger volumes of natural gas than ever before during the 2013-2014 winter heating season (WHS). On Jan 7, 2014, the United States set the single-day record for natural gas consumption at 139 Bcf – almost double the daily average.
Daily consumption levels also reached record highs in the residential, commercial and power generation markets in January 2014. In fact, natural gas demand by the electric power sector was 2 Bcf/d higher than the prior five-year average. Industrial demand was also above average – consistently 3 Bcf/d higher in January, compared to the five year average for the same month.
Underground Storage
Underground storage played its most critical role ever in supplying gas to meet customer needs – a result of a decade or more of investment in storage capacity, expansion and improvements, which helped ensure availability and deliverability of stored gas on the coldest winter days.
During the 2013-2014 WHS, underground storage provided more than 20% of the supply and set records for monthly withdrawals. The previous record for net volumes withdrawn from storage during a winter heating season month had been 847 Bcf in 2003. That record was shattered in January 2014 with more than 950 Bcf withdrawn.
In addition to domestically produced gas and withdrawals from storage, small but critical amounts of LNG and propane-air peaking facilities may be used to meet the needle peak of coldest day demand. Of course, natural gas imports from Canada serve a critical role on a daily basis, as well as on the margin on the coldest days.
Gas Production/Reserves
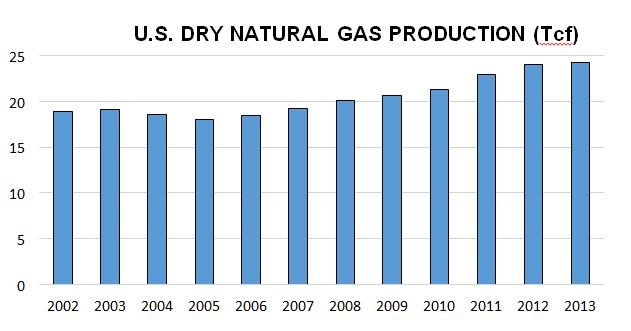
U.S. DRY NATURAL GAS PRODUCTION (Tcf)
Source: Energy Information Administration
Dry gas production grew from less than 20 Tcf annually to nearly 25 Tcf during the 2003-2013 period. Moreover, domestic production is expected to continue to grow as additional unconventional and conventional resources are developed and as demand requirements continue to pull on a growth gas market.
As with production, natural gas reserves have grown steadily during the past decade. Underpinning domestic production capacity, natural gas reserves have grown from less than 200 Tcf in 2003 to 330 Tcf in 2013.
Gas Prices
Despite the WHS conditions, residential customer bills increased only 10% on average from the prior winter – an increase mostly due to higher consumption.
This is not to say, however, that price movements were nonexistent. As cold temperatures continued through February, cumulative draws on flowing gas and storage assets resulted in price jumps for both the Henry Hub spot and contracts for the next-month delivery. For three days, futures prices sat above the $6 per MMBtu mark, then fell quickly to $5 and back toward the $4 range. The report says these short-term price movements were in part a function of persistently high demand, temporary disruptions in flowing gas and, in some cases, constrained storage supplies that served as signals from traders to suppliers – in particular those with storage assets—to push volumes into the market.
Despite the Henry Hub commodity prices remaining at relatively nominal levels, local prices for supplies entering the Boston and New York City areas jumped above $100 per MMBtu due to basis differential blowouts. It is also noted that these extreme price movements represent the value paid for gas commodity at the margin.
Concerning near-term pricing, AGA expects relatively warmer temperatures this coming winter based on information from the climate Prediction Center, which may lead to a reduction in demand. Natural gas prices are likely to be slightly higher, resulting in an increase in customer bills of about seven percent this winter.
Service Interruptions
Numbering more than 66 million, residential consumers are by far the largest natural gas customer segment in the United States, and they depend on the LDC to manage all aspects of their gas service. However, they consume not more than 64 MMBtu of natural gas on average annually. In contrast, the typical interruptible utility service customer is an industrial plant (numbering 180,000 nationally) that consumes 21,343 MMBtu or 339 times more gas than the typical residential customer.
Given the extreme weather conditions, the AGA survey shows a number of companies found it necessary to curtail service to interruptible customers this past winter: 51% (43 of 84 reporting) haltered service to interruptible customers temporarily, either on a peak day (40 companies) or on another day (27 companies). Significantly, 33 companies did not interrupt any customers, even during extreme weather conditions.
Gas Supply Portfolios
LDCs build and manage a portfolio of supply, storage and transportation services to meet peak-day, peak-month and seasonal gas delivery requirements. Also a specific methodology is used for determining a design day temperature calculation, which influences the construct of their gas supply portfolio.
Based on AGA survey data, natural gas utilities used 88% of supply assets (or projected design day volumes) this past winter. The data also indicated the following as supply sources for the non-coincident peak day: 35% of the 63.4 million Dth delivered arrived at LDC city gates via firm pipeline transportation, 21% from pipeline or other storage, 18% as shipments for transportation customers, and 14% from on-system underground storage, adding up to 88% of peak day supply. Also, those same four sources of gas supply accounted for 91% of peak-month gas supply.
U.S. natural gas distribution customers by customer segment
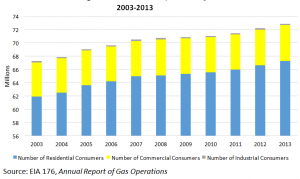
Source: EIA 176, Annual Report of Gas Operations
During this same period, the natural gas distribution system also expanded. Distribution mains increased from by nearly 1.1 million to more than 1.27 million miles during this 10-year period.

Source: DOT 7100, PHMSA, Annual Report Data from Gas Gathering, Gas Transmission, Hazardous Liquids and LNG Operations
This infrastructure growth is also reflected in recent increases in construction costs. For all parts of the natural gas value chain, construction expenditures were consistently higher during the period of 2011-2013.
U.S. Natural Gas Industry Construction Expenditures
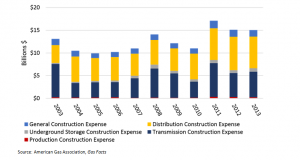
Source: American Gas Association, Gas Facts
AGA President and CEO Dave McCurdy said of the report, “We expect the trend of greater demand to continue, and it will be accompanied by substantial growth in domestic natural gas supplies and increased infrastructure development to deliver this gas to more customers. This supply-demand balance lends itself to continued market stability, thereby creating more opportunities for natural gas in our nation.”
Editor’s Note: The full Promise Delivered report can be viewed on the AGA web site www.aga.org.

Comments