
April 2016, Vol. 243, No. 4
Web Exclusive
OPEC Report Suggests Massive Oil Price Rebound
The headlines reacting to OPEC’s April Oil Market Report generally read “OPEC concerned about global oil demand” and as such, oil prices traded down slightly on April 13, despite an overall positive market.
Well, I’m concerned about global oil demand also, so I thought I better read their report. Clearly, the commodity never performs well in the face of stagnant or shrinking economic activity – no commodity does – in fact, nothing does. Except maybe alcohol sales. In any case, I am concerned with exactly how worried OPEC was about global oil demand and by extension, global GDP growth. Guess what? It turns out that despite the green lobby’s insistence, world economic activity is strongly reliant on hydrocarbon consumption and vice versa.
Anyway, what I found in the report was not so much concerns about GDP growth in various regions of the world, although these are expressed and reviewed, but rather the underlying prediction of a massive rebound in oil and gas activity during the second half of 2016! By extension, for non-OPEC production to rebound, the cartel must be assuming much higher oil prices beginning, well, about now.
Is this foreshadowing that a big production cut deal will come out of the Doha Qatar meeting this weekend? Probably not. In any case, I keep thinking, what if OPEC told us oil prices were going up sharply, but they buried the news deep in an 85 page report and nobody noticed?
Maybe they did. However, the fact is OPEC did not mention surging oil prices or sharp increases in exploration and production activity in their report, but they implied it. As subtle as the implications were, those commentators that managed to read only the first page summary of the report failed to grasp its true meaning. But in fact, to make the numbers add up, the only explanation is that OPEC is very bullish on both oil prices and oil service activity. Let me explain.
First it’s necessary to set the backdrop by reviewing oil and gas fundamentals at a 50,000 foot level. Overall, OPEC is expecting that global growth in oil demand (really all liquids demand) in 2016 will average 1.2 million barrels per day (mb/d). That is, demand will average 94.2 mb/d vs the 93 mb/d average in 2015.
These estimates are pretty much in line with other analysis like the IEA’s Oil market report (95 mb/d) and represent a slowdown in growth from the 1.5 mb/d increase seen 2014 to 2015. Demand growth is predicated on a global GDP growth rate of 3.1 percent vs 2.9 percent world GDP growth rate in 2015.
Why OPEC estimates stronger GDP growth but slowing oil demand growth is another question altogether. Setting that aside, OPEC notes stability in first quarter PMI numbers in the U.S., weak, but respectable numbers in Europe and Japan, improving numbers in China and India, etc to support its GDP assumptions…OK I won’t argue. Clearly the risk to 2016 oil demand lies squarely in how reality aligns with these expectations…once again, no surprise there.
So, how do the world’s oil producers – battered and bloodied by an 18 month drop in prices – supply the additional 1.2 mb/d of oil the world is expected to burn in 2016? That is the $100 billion dollar question and this is where the fun starts! Why $100 billion? Because that is the magnitude of the reduction in investments in oil and gas development that companies have announced for 2016 relative to 2015.
What about private companies and other countries that don’t report to shareholders? Good question, but no doubt they are spending less in 2016 than 2015.
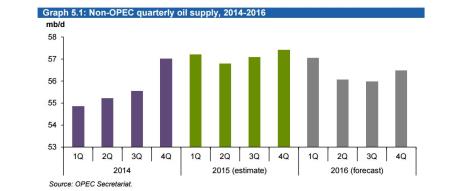
So here is where I start to sense that OPECs monthly oil market report and reality have, let’s say, diverged onto different paths. OPEC details how production is essentially falling all over the world after achieving strong growth in 2015. In particular, non-OPEC supplies grew by 1.5 mb/d to reach 57.1 mb/d in 2015. In 2016, noting the aforementioned large drop in CAPEX and the corresponding rig count, non OPEC production is expected to fall by nearly 800,000 bpd.
In both cases, U.S. tight oil is leading the way. In particular, U.S. tight oil volumes are falling the fastest. They note that in March, these volumes are expected to be down over 700,000 bpd from their peak in the first quarter of 2015. They also note the falling rig count as a major driver, possibly leading to increasing rates of production declines during 2016. Got it – rig counts drop to the lowest levels since the 1980s, production falls hard. Especially in tight oil where new wells typically decline by 75 percent in their first year of production. No brainer there. Most analysts have realized this.
However, what about the current oversupply you ask? Are they not just saying that the market will just absorb the excesses of a currently oversupplied market? Yes. However, based on their own estimates, the market is basically in balance today. As such, here is where their projections start to deviate from logic – or to suggest a rebound is upon us. Below is OPEC’s forecast of non-OPEC production by quarter. The group notes that the world has seen a sharp drop in oil production during the first quarter of 2016. Various sources have already reported much of this information. Importantly, OPEC is predicting larger decreases in production in the second quarter of 2016 as the drop in activity that accelerated last December, really starts to impact production. Once again, this is starting to be accepted by those that pay attention to the data. These declines have recently garnered some press attention and I believe played a role in the recent oil price rebound.
This is all as expected – the global oil industry cannot grow volumes in a $30/bbl oil world. In fact, at that price, cash flows are insufficient to warrant investment even to the levels necessary to replace production – much less grow volumes. Many have been saying this and dropping production is the evidence that they are correct.
However, fast forward to OPEC’s estimate for third quarter 2016. They predict flat production relative to the second quarter. Further, in the fourth quarter, they predict non-OPEC production growth!
How will the world achieve this? It will require a massive reversal of capital spending, and therefore a massive increase in the rig count and oil service activity. How massive? We estimate that in the Eagle Ford shale alone, the rig count would have to increase by 100 percent and the working frac fleets by 150 percent just to keep production flat. I have often compared this type of change to turning a supertanker.
However, at this point, it may be too late! We are going to hit the dock…why? It typically takes six to nine months for rebounding service activity to impact volumes – maybe less in the shale plays? Maybe, we’ll see. But history has shown that most regions react much slower to price changes.
Setting the previous point aside for a moment, take a look at fourth quarter estimates. Yes, OPEC is predicting that non-OPEC supplies grow by 500,000 bpd in the fourth quarter of 2016. In their estimates – half this growth – 270,000 bpd comes from the Americas with the U.S. leading the pack, growing volumes by 140,000 bpd from Q3 to Q4 2016.
To do this, the rig count would have to increase by something on the order of 3x current levels and all other oilfield services would necessarily steeply ramp up. This is achievable, but to get there, I believe would require oil to shoot to around $60-70/bbl and we would have to start right now. My real prediction is a slower ramp through the first half of 2017, mirroring a ramp in oil prices. The good news from this report is that this will happen at minimum, barring collapsing world GDP forecasts or surging OPEC volumes.
In fact, OPEC is not just predicting increasing volumes in the Americas – they are predicting increasing fourth quarter production everywhere! Asia, Latin America and Africa are expected grow volumes by a combined 100,000 bpd off the 3Q 2016 lows while both Russia and China add 50,000 bpd each. Even Europe is expected to kick in growth of 130,000 bpd.
As of today, production is falling in all of these regions. Sober analysts have been downgrading production estimates almost universally for the past few months. Likewise, service companies have been steadily lowering revenue estimates for the second quarter and the remainder of the year. As such, what changes in the third and fourth quarters? We are in mid-April now. The fourth quarter is only a short 5 months away – the industry better get going.
Just so one does not believe that OPEC is behind the times, they note the massive drop in activity levels that accelerated in the first quarter. Below is an up to date representation of what we are living in the U.S. Far from any kind of rebound, the charts below seem to suggest the industry is going to zero!

The momentum of the declines seen in the first quarter further highlight OPEC’s prediction of a second half rebound in volumes. The following is their estimates of both U.S. and total Americas supply growth. In both cases, after falling hard first to second quarter of 2016, volumes are flat in the third quarter and increasing again in the fourth. The only explanation for this is massive reinvestment driven by a massive increase in spending.

Or maybe not. Let’s look at some alternative explanations. Maybe OPEC is scared that shale producers have gotten so good extracting oil from impermeable rock that only a slight pickup in price may lead to massive new volumes. OPEC cites a quote by Pioneer Natural Resources that said they could put as many as five rigs back to work if oil stabilized above $45/bbl. With Pioneer’s rig count dropping from over 40 to 12 in the past 12 months, five incremental rigs is not going to spell rebounding U.S. production.
While the industry is getting more and more efficient, the laws of large numbers are immutable. With tens of thousands of horizontal wells declining daily, several thousand new wells are required to replace these volumes, and there is no evidence of any rebound yet.
Here is the bottom line for OPEC. In the following chart, “required” OPEC production – meaning volumes required to balance the global market which considers the inputs of supply and demand for the world– are shown in the orange line. The blue bars are actual OPEC production. With actual production exceeding “required” production, global inventories rise and the oil price tanks. Historically, OPEC would pull a few barrels off the market to assure this didn’t happen. In November of 2014 they famously didn’t.
However, assuming flat OPEC volumes, based on this chart, supply and demand are effectively in balance in 3Q 2016. In fact, demand slightly exceeds supply implying that high global inventories begin to drop. This is the point where prices stabilize and begin to rebound.
In the fourth quarter, as shown, demand for OPEC volumes is falling. However, keep in mind that this is predicated on increasing production volumes from the rest of the world. An assumption that could only come true if a massive rebound in oil prices and activity started today.

In reality, what is likely to happen is the third quarter call on OPEC will be about 1 mb/d above supply, resulting in strong inventory draws. This will push oil prices to the highest levels seen at least over the past 12 months. Given this signal, the industry will start to put capital back to work.
However, this will take a while – most of those laid off last year and this have found other jobs. Remember the 6-9 month lag between increases in rig count and volume growth? It could be even longer before volumes are truly growing again. If not in the U.S., certainly in the most of the rest of the world.
As such, let’s say fourth quarter is flat with our revised third quarter. Then the call on OPEC would be around 1.5 mb/d, resulting in further reductions in global inventories. In addition, oil prices would likely head higher and the strip would enter backwardation, prompting further draws from inventories. Under this scenario, non-OPEC volumes are unlikely to grow sufficiently to meet global demand until the second half of 2017. To achieve this, rising oil prices are just around the corner.
In every cycle, analysts and pundits try to make sense of the current environment. When oil prices were above $100/bbl, many argued such high prices were necessary because global F&D costs had risen to that point. Likewise, at the bottom, many have argued that $30/bbl is the new price level and given OPEC’s low marginal costs, prices could not rise. Neither was true. Prices and supplies are cyclical and the oil market is self-correcting. Wells decline daily. Cash must be invested in large quantities just to keep production flat and even in larger quantities to grow production.
As such, the only way OPEC can make these projections is through sharply rebounding oil prices. Further, to make these numbers, this has to begin now. So in reality, maybe they are telling us without actually telling us, that they are about to hit us with a price shock.
I don’t think so. I think they want to avoid any such messy outcome. However, we can recognize that the correction process is happening. But the rebound in investment is nowhere in sight making it unlikely that volume declines suddenly stop and then reverse in the second half of 2016. What this really tells me is that prices got out of control, dropped much further than the cartel expected, but they couldn’t reverse course without losing credibility. Maybe we all will be better off when they just leave markets alone.
By Brad Beago for Oilprice.com

Comments