
August 2019, Vol. 246, No. 8
Features
Pipeline Constraints, Not Export Ban, Caused Big Price Differentials
By Greg Upton, Assistant Research Professor, LSU Center for Energy Studies and
Mark Agerton, Assistant Professor, Department of Agricultural and Resource Economics, University of California, Davis
Over the past decade, the primary U.S. crude benchmark, WTI, diverged considerably from its foreign counterpart, Brent, sometimes selling at a steep discount. Some studies pointed to the ban on exporting U.S. crude oil production as the main culprit for this divergence.
However, scarce domestic pipeline capacity explains half to three-quarters of the deviation of mid-continent crude oil prices from their long-term relationship with Brent crude. In other words, internal constraints in the U.S. crude transportation market, not the external constraint of an export ban, mostly explain the crude price differentials. This highlights the major importance that midstream infrastructure has for upstream producers.
Motivation
In 1973, OPEC imposed an embargo on selling oil to Canada, Japan, the Netherlands and the United States. The embargo lasted from October of 1973 to March of 1974. It sent the U.S. economy into a tailspin. In 1975, President Gerald Ford signed a policy response: the Energy Policy and Conservation Act (EPCA).
The act prohibited companies from exporting domestically produced crude oil or natural gas. It also created the Strategic Petroleum Reserve.1 Despite the dramatic beginnings of the export ban, the ban received relatively little attention for decades because the U.S. was an importer of crude oil, not an exporter. The ban had no bite.
Thanks to the shale revolution, U.S. crude production surged over the past decade. As U.S. production increased, the primary U.S. crude benchmark, WTI, diverged considerably from its international counterpart, Brent. Where WTI once fetched a $2/bbl premium over Brent, it now traded at a discount. At one point WTI even traded $25/bbl lower than Brent.
This discount sparked a debate about whether the decades-old ban on exporting crude oil had trapped crude in the U.S., causing oversupply and a large price discount.1-3 In December 2015, Congress lifted the ban.
Despite claims to the contrary, our research suggests that the export ban likely had little role in causing the large discounts of domestic WTI to international Brent crude.
Economic Logic
The economic logic behind why an export ban would suddenly cause to price discounts is straightforward. Since there was no ban on the import of crude oil – only its export – refineries in the U.S. were able to purchase both foreign and domestic crude. U.S. crude oil production declined for nearly a half-decade, and domestic refineries gradually reconfigured themselves to process an increasing share of imported crudes. They made complex capital investments that allowed them to take relatively inexpensive, heavy, sour foreign crudes and upgrade them into expensive products. The export ban remained on the books, but it had no practical consequence.
Then in 2009, U.S. independent producers reversed the decline in domestic production. New production from unconventional shale formations led to unprecedented year-over-year increases in national production.
The chemical composition of the new light-tight oils (LTOs) produced from shale formations was very different from the heavy, sour foreign crudes that domestic refineries were processing. Domestic refinery configurations were not optimized to handle an increasing share of LTOs. To accept more LTOs and stay profitable, refiners had to buy LTOs at a discount.
Foreign refiners were willing to pay high prices for new volumes of high-quality LTOs, but the export ban prohibited these sales. Producers had to sell new volumes to domestic refiners at a discount.
Harold Hamm, CEO of Continental Resources, voiced shale producers’ angst:
“Major oil companies are exporting refined products with no limitations. Why shouldn’t independent producers be allowed to do the same? ... This would be equivalent to telling American farmers they can’t export their wheat yet allowing Pillsbury to export all of the processed flour they want.”4
Main Culprit
Shale producers’ inability to sell into the international market represented an external constraint on the market for domestic crude. There were also internal constraints within the U.S.
Pre-shale boom pipeline infrastructure was not built to handle the unprecedented new volumes of LTOs. Without sufficient pipeline capacity, producers were constrained in their ability to ship crude to refiners who demanded it. Oversupply built up in the mid-continent. Producers willing to pay higher transportation costs to the Gulf Coast started moving crude by rail and tanker. These more expensive, marginal modes of transportation drove down the marginal value of crude in the mid-continent. Prices fell where LTOs were produced.
Our analysis indicates that scarce pipeline capacity and internal shipping constraints within the U.S. can explain between half to three-fourths of the wedge between domestic and international crude prices. We do not find statistical evidence that the external export ban and refiners’ inability to process LTOs caused major domestic crude discounts.
There are two ways we decompose domestic crude discounts into internal and external constraints. First, we compare the discounts embedded in domestic prices for crudes that were and were not affected by internal shipping constraints. Second, we look at whether changes in shipping costs and refining slates are correlated with discounts.
Figure 1 illustrates the first decomposition. It shows the premiums of domestic West Texas Intermediate (WTI) and Louisiana Light Sweet (LLS) crudes over international Brent crude. The two crudes have similar chemical properties and are close substitutes in refining. However, the price of WTI includes the marginal transportation cost to refiners on the Gulf Coast where LLS does not. Insufficient pipeline capacity should affect WTI much more than LLS.
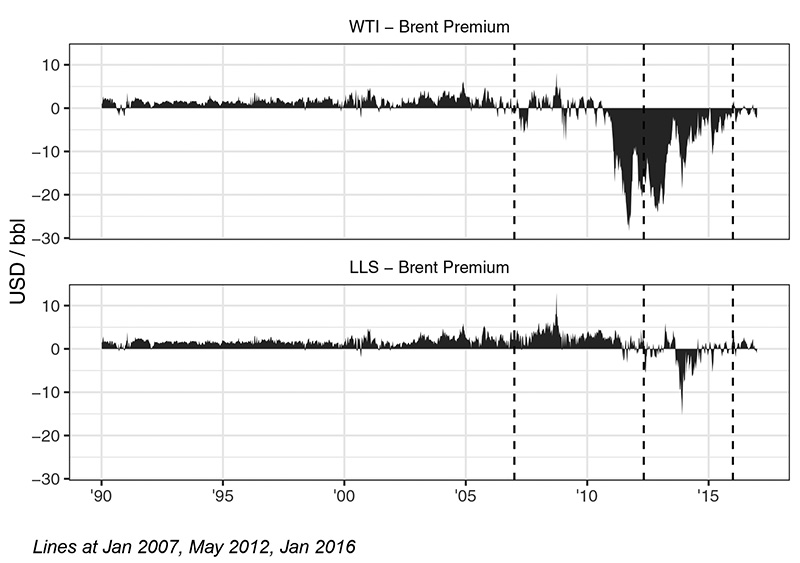
We compare the WTI and LLS premiums over Brent over distinct regimes. The regimes are separated by three vertical lines that represent (1) shale production coming online, (2) pipeline reversals and expansions, and (3) the lifting of the crude oil export ban.
The first vertical line is January 2007. This marks when the U.S. Energy Information Administration began tracking oil and natural gas production in shale areas as part of its Drilling Productivity Reports.
The pipelines in existence at this point were built to handle older, conventional crude production, not the incredible volumes of new LTO production. We consider January 2008 as the dividing line between a pre-shale boom period and when LTO production began to strain existing pipeline infrastructure.
The second line is May 2012 when the Seaway pipeline was reversed. This was the first of several post-shale boom pipeline expansions that relieved shipping constraints. Seaway initially moved crude from Freeport, Texas, on the Gulf Coast to Cushing, Okla., where WTI is priced. After the reversal, the pipeline carried crude produced in the mid-continent to Gulf Coast refineries. This line divides a regime of increasing internal shipping constraints from a regime when those constraints were relieved.
The third line is December 2015, when the U.S. government lifted the export ban that constrained external LTO sales.
Figure 1 shows that both WTI and LLS traded at a premium to Brent during the pre-shale regime, before January 2007.
After 2007, the WTI premium became more volatile. By 2011, LTO production was booming in North Dakota, and there was insufficient pipeline capacity to move crude from the mid-continent to the Gulf Coast. The price of WTI was much lower than the price of Brent. This reflected the high marginal cost of transportation to the Gulf Coast. WTI recovered after Seaway was reversed in 2012 and more pipelines were upgraded.
The LLS premium behaved much differently during this time period. It actually increased a bit in 2007 as LTO production was rising. Not until the Seaway reversal in 2011 did the price of LLS fall below Brent. Both the longevity and magnitude of the LLS discount were significantly less than WTI’s.
By the time the export ban was lifted in December of 2015, neither WTI nor LLS was experiencing a meaningful discount. The prices of WTI and LLS did not rise compared to Brent. They had already recovered. All in all, Figure 1 suggests that it was mid-continent crudes affected by internal shipping constraints – not coastal crudes that only faced external constraints – that experienced a discount.
Figure 2 further investigates the extent to which shipping constraints can explain the discount of WTI relative to LLS. The scales and vertical lines in Figure 2 are exactly the same as Figure 1. The top panel of Figure 2 shows the share of crude oil transported from PADDs 2 and 4 in the mid-continent (states in the Rocky Mountain and Midwestern regions) to PADD 3 in the Gulf Coast (states from New Mexico to Alabama).
For the 17 years from 1990 to 2007, almost all crude was transported from the mid-continent to the Gulf Coast via pipeline. Shippers used pipelines because rail and tanker are more expensive. During this time, WTI and LLS moved in lockstep.
In fact, by April 2012, more than half of the crude shipped from the mid-continent to the Gulf Coast went via high-cost barge and rail. Almost immediately after the reversal of the Seaway pipeline, this trend stopped and share of crude shipped via pipeline began to recover.
The LLS-WTI premium closely mirrors changes in mode of transport over the 2007-2015 time period. This close correlation between shipping and prices can explain between half to three-quarters of the movement in relative prices. Changes in the composition of refining as captured by API gravity cannot do this.
This provides strong evidence that shipping constraints between the mid-continent and Gulf Coast were the culprit for price discounts – not necessarily the external shipping constraint imposed by the export ban.
Conclusion
Some studies have claimed that government regulation in the form of the export ban distorted the crude oil market and caused large declines in oil prices received by shale producers. They argue that new, light tight oil production was ill-suited for U.S. refinery configurations but had nowhere else to go because of the ban.
We rigorously investigate these claims. We find that internal constraints in the crude transportation market – not external constraints – drove the dramatic, short-term discounts in domestic crude prices. Private investment eliminated these discounts, not government action.
Exports of LTOs have increased over the past few years, and the international market will undoubtedly represent an important source of demand for domestic crudes. However, in framing policy debates around shale production, it is important to stay grounded in the data. P&GJ
This article is based on research by Mark Agerton and Gregory B. Upton Jr. “Decomposing Crude Price Differentials: Domestic Shipping Constraints or the Crude Oil Export Ban?” The Energy Journal, Vol. 40, No. 3.
Authors: Greg Upton is assistant research professor at the LSU Center for Energy Studies. His research interests are related to the analysis of economic, environmental and public policy issues in the energy industry.

Mark Agerton is an assistant professor in the Department of Agricultural and Resource Economics at the University of California Davis. He works on economic and policy issues in energy and natural resources.

References
[1] Yergin, D., K. Barrow, J. Fallon, M. Bonakdarpur, S. Sayal, C. Smith, and J. Webster (2014). “U.S. crude oil export decision: Assessing the impact of the export ban and free trade on the US economy.” Technical report, IHS Energy.
[2] Ebinger, C. and H.L. Greenley (2014). “Changing markets. Economic opportunities from lifting the U.S. ban on crude oil exports.” Technical report, Brookings. https://www.brookings.edu/blog/planetpolicy/2014/09/09/changing-markets-economic-opportunities-from-lifting-the-u-s-ban-on-crude-oil-exports/
[3] Upton, GB (2015). “Crude Oil Exports and the Louisiana Economy. A discussion of U.S. policy of restricting crude oil exports and its implications for Louisiana.” LSU Center for Energy Studies Whitepaper. https://www.lsu.edu/ces/publications/2015/Upton-CrudeOilExports_LouisianaEconomy.pdf
[4] Helman, C. “Why America’s Crude Oil Export Ban Should be Lifted.” Forbes. January 2014. https://www.forbes.com/sites/christopherhelman/2014/01/31/why-americas-crude-oil-export-ban-should-be-lifted/#5e48cedb30fe

Comments