
February 2021, Vol. 248, No. 2
Features
Integrating Flow Assurance Engineering Domains Ensures Operations in Caspian Sea
By Amir Alwazzan, Dragon Oil and Abul Jamaluddin, Stratum Reservoir
Once the term “flow assurance” was coined in the 1990s, continued evolution in the offshore marketplace has demanded that the industry invest in advancing the design, strategies and principles that form the core of this burgeoning field.
When exploring how to make offshore development more profitable, nothing is as critical as ensuring that hydrocarbons quickly and cost-efficiently make it to the point of sale. While offshore drilling and production have always faced greater challenges than onshore operations,[1] this has been exacerbated in recent years by changing dynamics in more complex and deeper reservoirs along with longer subsea production lines.
The deep and ultradeep-water depths and long subsea production lines pose challenges in greater temperature and pressure changes while fluids travel to the production facility. These changes in temperatures and pressures result in not only fluid compositions but also changes in flow dynamics. These changes ultimately impact production chemistry, resulting in organic and inorganic solids precipitation, and pose production impairment.[2]
Because of the intricacy of the systems involved in the flow assurance process, any attempts to deal with issues have historically incurred significant costs and time, especially when intervention technologies and operations have been necessary. Various workflows dealing with management of fluid dynamics and production chemistry has been discussed and presented in numerous publications and presentations.
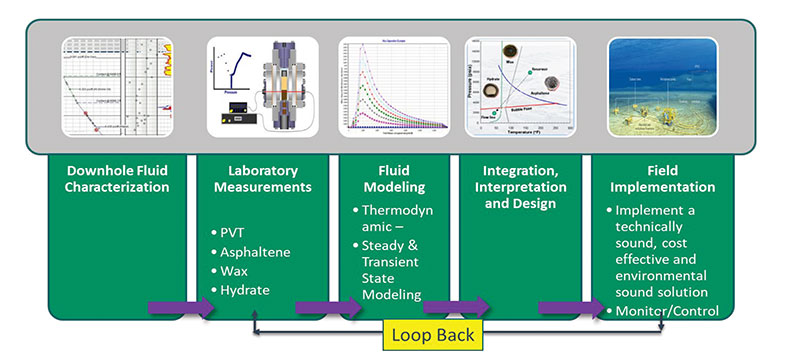
Figure 1 illustrates the fluid characterization workflow from downhole measurements to capturing the samples and laboratory fluid pressure-volume-temperature (PVT) characterization.
Consequently, the asset team in an operating environment take these measurements and develop thermodynamic fluid models. Further to developing thermodynamic models, the flow assurance and/or facilities team then use these thermodynamic fluid characterizations and build models in the steady-state and transient-state to create the overall field development plan (FDP).
Consequently, the asset team will then build various scenarios and finalize one based on various risk-reward analyses. The implementation process then starts, and the first oil dates are set. Once the facilities are fully operational, flow assurance engineers then start to monitor fluid properties to ensure the actual operating conditions are in line with design parameters.
In case of any deviation, flow assurance engineers then will take either new samples and recharacterize the fluid properties when opportunities exist in the appraisal environment and retune the operating conditions to ensure hinderance-free production.
Recently, authors introduced an unconventional strategic tactic to integrate three critical flow assurance domains – production chemistry and integrity, production engineering and operations, and production system monitoring and optimization. The domains together allow effective mitigation of complex and severe flow assurance issues. The approach is based on validating, correlating and integrating the outcomes of different studies conducted in these three domains, with the intent to implement a new flow assurance regime and reduce or eliminate the usage of chemicals.
Functional Domains
To adequately manage the hydrocarbon production systems and achieve the objective production target without any interruptions, all flow assurance-related undertakings must fall into three categories as detailed in the following.
Production chemistry and integrity involve the design of a process to capture produced fluids’ samples and conduct laboratory analyses to better understand the characteristics and features of the produced fluids. Undertaken by flow assurance engineers, this process determines the propensity of the system in the pressure, temperature and composition regime to experience chemistry-related issues, such as organic or inorganic solids depositions. In addition, the flow assurance engineers examine the efficiency and effectiveness of different chemicals.
Production engineering and operations model the entire production system in both green and brownfields, which is critical when identifying, assessing and controlling important production-related parameters during steady and transient operation conditions. This domain consists of various processes, including heat-transfer analysis, liquid and slugging management, fluid deliverability, pigging operations, comingling, bottlenecking and sand management.
When the production system goes online, flow assurance engineers must continually monitor its performance. This allows them to identify and address production bottlenecks, develop benchmark models for future projects and create plans to optimize the system’s operability. Without this type of monitoring and operation, the likelihood of encountering problems increases while the ability to rapidly address them decreases.
Field Information
The example field presented in this article is in the Cheleken Contract Area, which is offshore Turkmenistan in the Caspian Sea at a water depth of approximately 242 feet (80 meters) (Figure 2).
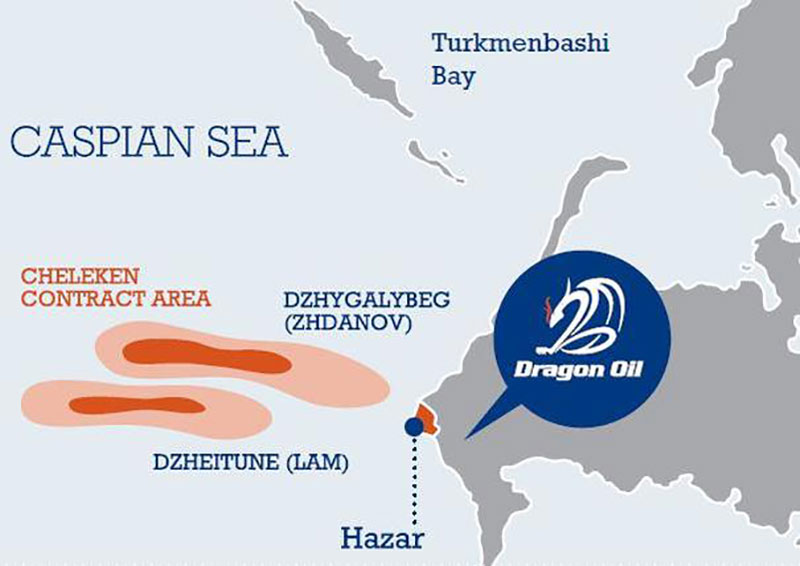
The Cheleken block covers about 590 square miles (950 square km) and comprises two offshore fields. Initial exploration and commercial drilling took place in the 1960s, followed by several workovers and the installation of a new wellhead and production platform.
The area continues to produce to this day, reaching peak production in excess of 100,000 bopd in 2015. The block is geologically complex, with a thick, highly faulted, sedimentary succession of shales and sandstones along the eastern edge of the Caspian Sea, interspersed with some limestones and conglomerates.
The production system consists of several platforms connected to a central processing and storage facility located onshore via a network of more than 155 miles (250 km) of infield flowlines.[3]
Field Example
Daily production operations for the Cheleken block are challenged by waxy oil production with high cloud and pour points, relatively low reservoir temperatures and increased water production and complicated subsea topography.
Harsh environmental conditions add additional layers of complexity to managing and maintaining production. Due to these difficulties, the operator sought to implement an improved flow assurance regime based on thorough analyses of the three functional domains described earlier.
For production chemistry and integrity, sampling and laboratory analyses were conducted to determine the tendency of the system to experience organic and inorganic solids deposition and accumulation.
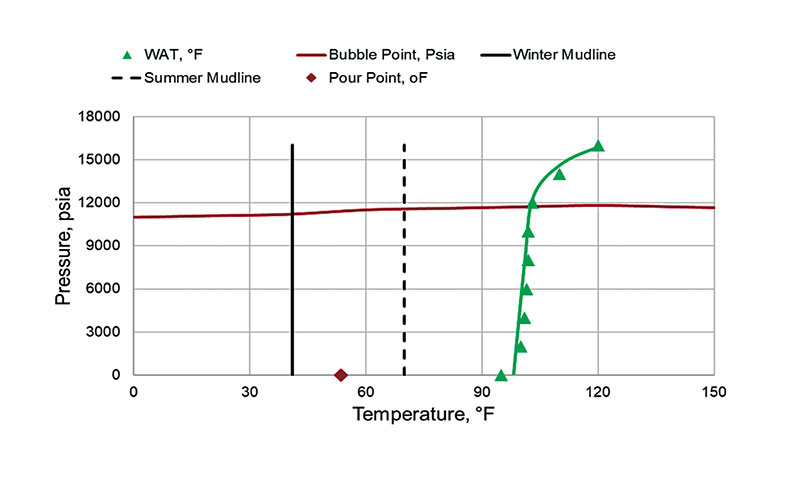
Thermodynamic simulations were also conducted. Laboratory measurements and thermodynamic modeling results are shown in Figure 3. The tuned saturation pressure (red) and cloud point or wax appearance temperature (WAT) lines are a result of simulation using a commercially available equation-of-state (EOS) modeling software. Modeling results along with measured data are presented as red and green lines in Figure 3, respectively.
Results reveal that the system operates outside the hydrate formation pressure-temperature regime during both steady-state production and shut-in conditions. The system was susceptible to severe wax precipitation, due largely to the high wax appearance temperature (WAT) of 95° F (35° C), low pour point of the produced oil of 54° F (12° C), low flow rates and relatively low reservoir temperature.
Oil characteristics are presented in Table 1. Wax precipitation and deposition issues in the winter months were especially apparent when the mudline temperature was lower than the pour point temperature of the hydrocarbon fluid.
Table 1 – Summary of Reservoir Fluid Properties
|
Reservoir Fluid Properties |
Values |
|
Reservoir Fluid, API |
37 |
|
GOR, scf/stb |
1,200 |
|
Wax Content, % (w/w) |
10 |
|
WAT, ° C |
35 |
|
Pour Point, ° C |
12 |
Injection of a combination of pour point depressant (PPD) and wax inhibitor (WI) was introduced by the production chemistry team to control the propensity for significant wax deposition and ensure reliable production operations.
Typical scenarios involving such a large and complex flowline, expected severe wax deposition and throughput variations would have called for a moderate injection rate of combination chemicals (PPD and WI) of 500 ppm to reduce viscosity and yield stresses.
This injection rate to control wax deposition in the flowline with a throughput of about 90,000 bopd mandated approximately 1.313 gallons per day (7,155 liters per day) to ensure proper inhibition. At $6.20 per liter of this chemical, the daily continuous consumption for flow assurance would increase annual operating costs by more than $16 million.
Comprehensive steady-state and transient-state modeling work using a commercial simulator (OLGA) was carried out in the production engineering and operation domain to simulate the thermal-hydraulic behavior of the produced fluids in the entire system.
The goal of these simulations was to construct the fluid profiles along each flowline, identify flow regimes during different operating conditions and assess existing slug-catching capacities for managing liquid properly during steady- and transient-state operations. The simulations showed that the fluids’ temperatures in the lines were below the WAT and therefore posed a serious concern for wax precipitation and deposition.
Wax management strategies in the flowlines consisted mainly of continuous pigging operations. One of the most critical lines was a 30-inch (76.2-cm) trunk line (TL), which extended for approximately 24 miles (39 km). Pressure sensors at the TL inlet and outlet took regular readings, which with flow rate readings were used to benchmark the line model to extract other relevant information, such as liquid holdup in the line and flow patterns.
Severe slugging was the predominant flow pattern during daily production operations in most of the infield flowlines, necessitating development of strategies to control the daily liquid production and during pigging operations.
Flow assurance engineers and field production personnel worked together to evaluate ways to improve flow assurance management strategies and system performance while optimizing operational costs without risking system reliability and integrity. Analysis of field data to understand the nature and extent of the impediments revealed that the propensity for slugging along with the presence of water could be used to minimize wax deposition.
This intermittent severe slugging nature was, in fact, beneficial to the production behavior and preventing the wax deposition by constantly altering the conduit’s wettability at low and cold points in the flowline. In addition, a produced water cut of approximately 16%, driven by the turbulent nature of the slugging regime, facilitated the optimal deployment of this strategy.
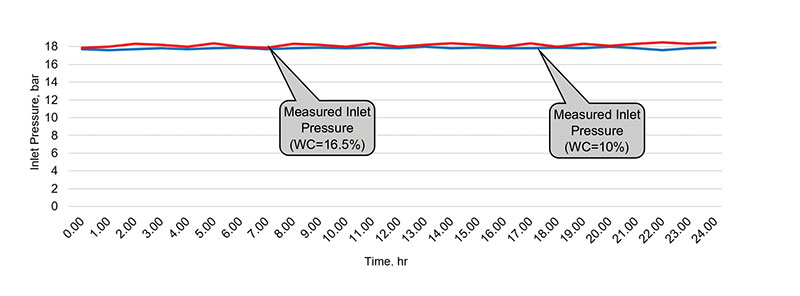
The plan could only be successful if operating conditions were changed and validated with previously established guidelines related to production chemistry and fluid flow criteria. These changing conditions had to be monitored concurrently with these operations, allowing the acquisition of real-time and logged data for analysis. Data collected included variation in flow rates, inlet and outlet pressures, amount and contents of retrieved solids during pigging operations, and separation efficiency at the central processing facility. Pressure readings were monitored for abnormalities during the deployment process and showed consistently stable inlet pressure in the line (Figure 4), indicating constraint-free flow.
This aligned with the modeling results of fully developed flow without any wax deposition in the line. Results also show that there was no evidence of wax-sand sludge formation, eliminating blockage during flow.
By validating and then implementing this novel strategic solution, the operator was able to improve performance and maintain flow without jeopardizing system operability and integrity. Production was continued without any PPD/WI injection throughout the year.
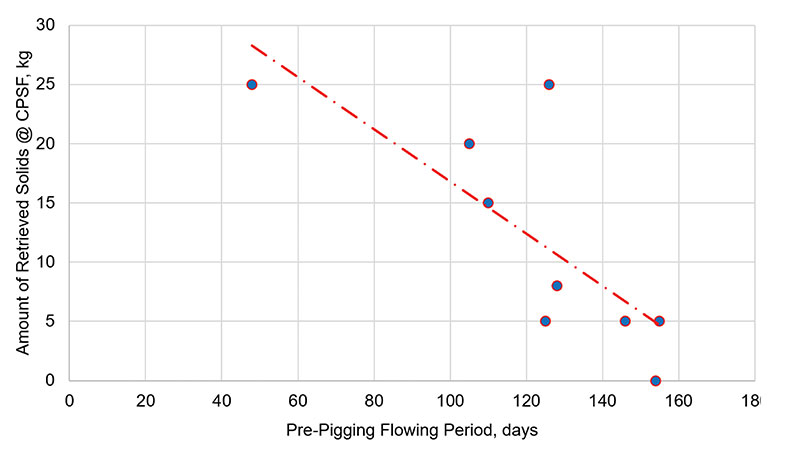
In addition, the line was continuously pigged and the deposited solids and debris after each pigging operation was measured and monitored at the receiving end of the pigging line. Results are presented in Figure 5. The amount of debris was decreasing with each pigging run. Further, based on the inlet pressure measurements, the pre-pigging flow period gradually increased, indicating minimization of wax deposition in the line and reducing the back pressure generated due to pigging operations in low-pressure wells.
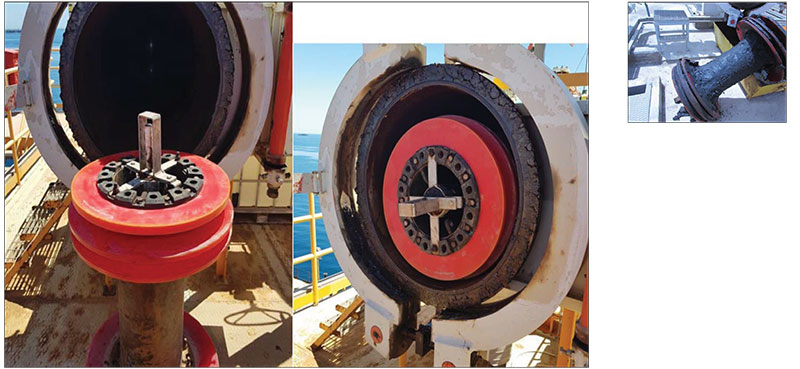
Figure 6 offers the photographic evidence of the pre- and post-pigs, demonstrating the effectiveness of the strategy of using intermittent slugging to prevent wax deposition.
Beyond these benefits, the elimination of PPD/WI injection saved the operator the $16 million it would have spent with conventional solutions before implementing this strategic solution.
Conclusion
The industry talks at length about innovation, and much of the published material focuses on the development of new technologies or equipment designed to improve efficiency in some way. In some instances, however, innovation comes in the form of taking an established process or activity and reinventing it, creating a better path forward.
Through successful integration of existing flow assurance engineering domains and extensive development of a new and more effective flow assurance regime, the operator was able to address flow-related challenges in the Cheleken block.
In this project, innovation was taking a conventional solution and totally rebuilding it from the ground up. The operator and the flow assurance team revealed that multiple flow hindrance issues do not always increase the magnitude of the problem; instead, they can negate each other if appropriately understood and managed.
Bringing together systematic fluid flow analyses to utilize the turbulent nature of severe slugging to suppress and overcome severe wax deposition and sand accumulation in a major TL, as well as working with subject matter experts and developing a truly integrated solution founded on sound flow assurance engineering, enabled a significant improvement to the pigging schedule and the elimination of a $16 million annual expenditure.
References
Al-Safran, E. and Brill, J. P., Applied Multiphase Flow in Pipes and Flow Assurance – Oil and Gas Production. Richardson, TX: Society of Petroleum Engineers (SPE), 2017.
Jamaluddin, A. K. M. and Kabir, C. S., “Flow Assurance: Managing Flow Dynamics and Production Chemistry.” Journal of Petroleum Science & Engineering 100 (2012): 106-116.
Alwazzan, A., Dashtebayaz, M. and Fiaz, M., “From Pore to Process: Novel Flow Assurance Approach to Suppress Severe Production Chemistry Issues by Flow Dynamic Characterization” SPE’s 21st Middle East Oil & Gas Show and Conference, Manama, Bahrain, March 18-21, 2019.

Comments