January 2021, Vol. 248, No. 1
Features
Policy Implications for Satellite-Based Methane Detection
By Jonathan Elkind, Erin Blanton, Hugo Denier van der Gon, Robert Kleinberg and Anton Leemhuis, Center on Global Energy Policy at Columbia University SIPA
(Editor’s note: This article is the first of a two-part series)
In August 2020, the Trump administration finalized plans to roll back regulations on oil and gas industry emissions of methane from new and modified infrastructure.
In the same month, the European Commission gathered stakeholder comments as part of its process to introduce the first EU-wide methane regulations.
Although contradictory in direction, these regulatory processes on opposite sides of the Atlantic highlighted a critical climate protection challenge: How can the oil and gas industry – and the regulators who oversee it – best detect and address methane emissions to protect the environment and the climate in particular?
The answer to this question will drive planning and operational approaches in the oil and gas industry. It could also significantly affect the future role of natural gas. Five years ago, many energy analysts expected natural gas to serve as a bridge fuel that would result in only half as much climate warming as coal, and fewer local air pollutants.

Among other roles, gas was seen as a natural complement for variable wind or solar power – a way to provide firm, dispatchable, low-emissions power. Now that it is apparent that our understanding of methane emissions is poor, the climate implications of gas are far less clear.
This poor grasp of methane emissions appears likely to become a thing of the past, however. In roughly the next five years, new satellite detection systems – used in concert with existing systems, aerial monitoring platforms and ground-based monitors – can increase markedly the transparency surrounding methane leakage.
The new wave of satellite monitoring capability has major implications for industry and governments. Our world is rapidly becoming a place in which methane emissions will have nowhere to hide.
This commentary, co-authored by the Center on Global Energy Policy and TNO, focuses on detection and response to oil- and gas-related methane emissions, which have been the subject of increasing focus on the part of industry and the public policy community.
It addresses the significance of methane emissions for the climate and the challenges of detecting and accurately quantifying methane emissions. It then explores the evolving capabilities of satellite-based methane detection and monitoring systems, which are expected to advance rapidly in the coming years, and which can be especially powerful when used in concert with aerial and ground-based monitoring systems.
It concludes with a discussion of the implications of the changing satellite detection landscape for the oil and gas industry, the finance and investment community, and the realm of public policy.
Consequential Issue
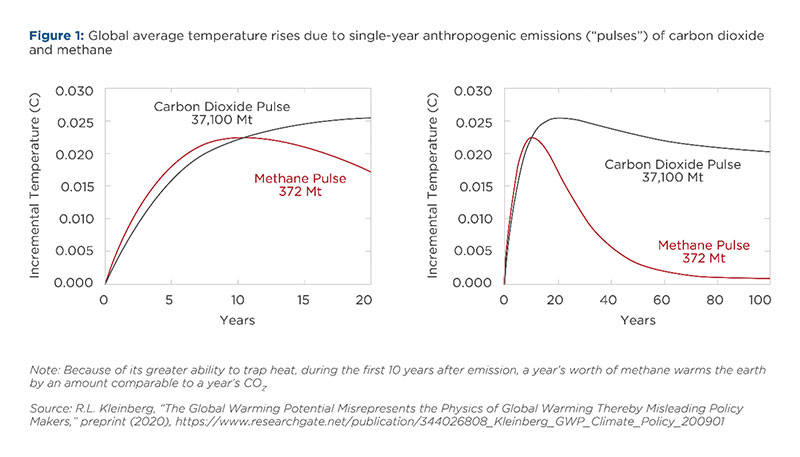
Methane is often thought of as a second-tier greenhouse gas, but this conventional wisdom misses two critical points. First, methane is pound-for-pound much more potent than the more plentiful carbon dioxide.(1) Carbon dioxide emissions are roughly 100 times greater than methane emissions each year on a mass basis, but methane and carbon dioxide are nonetheless roughly equal culprits in warming the planet over the following decades because methane traps heat so effectively.(2)
A second consideration, however, is that methane remains in the atmosphere for only a few decades, whereas carbon dioxide lingers for centuries. This implies that if methane emissions were reduced today, methane-driven warming would subside rapidly, in contrast to reductions of carbon dioxide emissions, which would have little immediate effect.(3) Methane emissions control is thus a consequential matter, because reducing emissions of this potent and short-lived gas can improve the global warming problem much more quickly than reductions in carbon dioxide emissions.
Figure 1 depicts these relationships, showing that in the first 10 years after a single year’s emissions of carbon dioxide and methane, the added methane warms the earth by an amount comparable to the warming by a year’s worth of carbon dioxide.(4)

Note: Because of its greater ability to trap heat, during the first 10 years after emissions, a year’s worth of methane warms the earth by an amount comparable to a year’s amount of carbon dioxide.
Atmospheric concentrations of methane have been rising since the start of the industrial era and today are more than twice as high as in the middle of the 18th century. The recent growth of methane concentrations threatens to place out-of-reach the Paris Agreement’s goal of limiting global average temperature rise to well below two degrees Celsius.(5)
A host of sources contribute to methane emissions, including agriculture, waste management, land use and permafrost melt.(6) Control of methane from the oil and gas industry, the focus of this essay, is not a simple task, but it represents a relatively straightforward means to respond to the growing atmospheric methane levels.
The Challenge
Given that controlling methane is a consequential objective, logical questions follow: How much methane does the oil and gas industry emit today, and from what aspects of its operations? Regrettably, the answers are not clear nor straightforward.
Methane emissions from the oil and gas industry occur due to either unintentional leaks or as a result of venting, sometimes in an uncontrolled manner.(7) Because methane is a colorless gas – and odorless until it is spiked with sulfur-containing compounds before commercial distribution – methane can easily escape undetected in the absence of effective monitoring.
The difficulty of detecting oil and gas methane emissions reflects in part the wide range of facilities and components across natural gas production, transmission, storage, and distribution systems, and the vast number of components in each system. In the United States alone, there are more than one million oil and gas wells, millions of miles of natural gas pipelines and thousands of compressor stations.(8)
In the absence of a comprehensive surveillance regime for methane emissions, regulators may rely on engineering estimates to approximate the amount of methane lost from various oil and gas infrastructure elements and their components.(9)
In the United States, for example, the Environmental Protection Agency (EPA) assigns each component type an emissions factor, reflecting its use in normal operation. Unfortunately, subsequent investigations have shown that these emissions factor estimates consistently underestimate the amount of methane lost to the atmosphere – often because the largest emissions events are due to abnormal process conditions that are not, or are insufficiently, accounted for in the estimation method.(10)
True Scale
All in all, just how bad are current figures for methane emissions from oil and gas? The simple answer is that one does not know for certain, and the answer may vary around the globe. The assessment that arguably constitutes the best overall quantification of emissions from U.S. oil and natural gas production, gathering, processing, transmission and storage found actual emissions significantly higher than levels reported through the official inventory of emissions.(11)
Moreover, methane detection methods that do not use continuous monitoring can overlook significant emissions in several broad (and overlapping) categories:
Vented Emissions: Certain releases of methane are partly avoidable but permitted, such as the release of methane (venting) resulting from liquid unloading of well bores during production and maintenance activities.(12)
Intermittent Emissions: Some of the most significant sources of emissions are intermittent. They are therefore likely to escape detection when inspections occur infrequently, for example, a few times a year. A successful inspection may give a false sense of security that is only revealed to be false when the next inspection occurs. Egregious examples include oil tanks, which vent volatile organic compounds and methane when temperatures rise.(13)
Flaring: In theory, flaring of gas from oil wells and other installations combusts methane and releases into the atmosphere only carbon dioxide, which captures heat less effectively than methane. In reality, flares are often inefficient and combust methane incompletely. Thus, a significant share of what is meant to be emitted as carbon dioxide is instead emitted as methane.(14) Unlit or malfunctioning flares are even bigger problems.(15) Moreover, flaring is generally underreported.(16)
Compounding the problems arising from these undetected methane emissions is the phenomenon of super-emitters. Some infrastructure elements emit quantities of methane far in excess of the median emitter of that type. For example, a meta study of about 20 device types found that 5% of leaks typically contribute more than 50% of total emissions.(17) Similar results are found across infrastructure types, and at all scales.(18) Worse yet, super-emitters tend to be intermittent, which means that they can be both large in scale and hard to detect.
To put the scale of methane emissions in perspective, it is worthwhile to compare the following points: The U.S. EPA estimated that compliance with its 2016 methane reduction regulations (40 CFR, Part 60, Subpart 0000a), with four inspections of covered components per year, would prevent the release into the atmosphere of 220 million kilograms of methane per year, which is equivalent to 25,000 kilograms per hour.(19)
The leak from the Aliso Canyon gas storage facility in Southern California, by comparison, emitted 100 million kilograms of methane in 112 days (an average rate of 37,000 kilograms per hour).(20) The blowout of a gas well in western Ohio vented 60 million kilograms of methane in 20 days (an average rate of 120,000 kilograms per hour).(21)
On a worldwide basis, incidents on this scale are not rare. Preliminary studies that utilize satellite data along with auxiliary information from a range of other data sources indicate it is possible to find, at any given time, 100 or more super-emitter sources emitting methane at rates exceeding 5,000 kilograms per hour.(22) It is suggested that about half of these super-emitters are associated with oil and gas infrastructure.
Satellite Detection
Given that methane emissions harm the climate, and at present are not well detected or quantified, new technologies stand to play an important role. Satellites are developing into powerful new tools for this role, especially when used together with traditional ground-based and aerial measurement techniques.
Ground-based systems typically provide the most accurate measurements of methane emissions, but they give localized data. Moreover, only a limited amount of ground-based measurement equipment is used for continuous monitoring. Aerial measurements have the ability to cover larger areas, but they are typically only used on the basis of overflight campaigns and are in some countries difficult to implement due to flight permit issues. A key advantage of satellite detection systems is their ability to provide recurring measurements over large, even global, geographies.
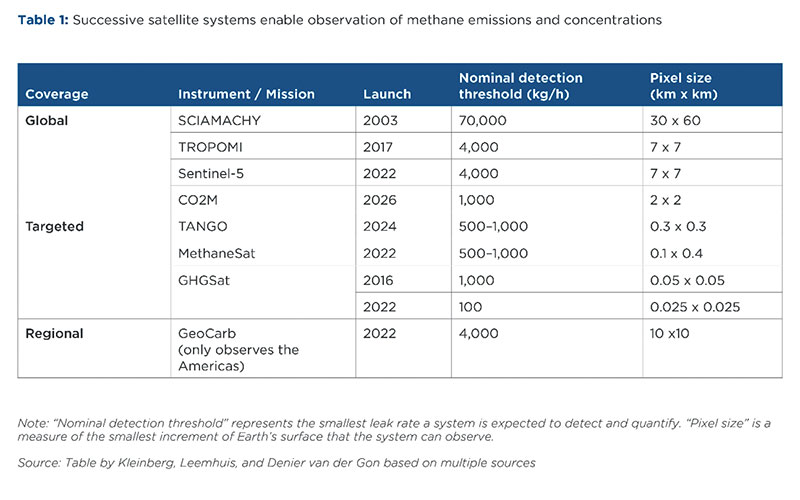
There are three broad types of satellite instruments and missions that can be used to measure methane from space (summarized in Table 1). The first category includes instruments that can provide full global coverage, typically on a daily basis. Often such instruments are part of scientific satellite missions that measure a wide range of gases in the atmosphere.
Currently, the most accurate methane detection system with global coverage is the Tropospheric Monitoring Instrument (TROPOMI), which orbits aboard the Copernicus Sentinel-5 Precursor of the European Space Agency (ESA). ESA has committed itself to two additional flagship missions in its Copernicus program, each with methane capabilities. These are Sentinel-5 (conventional air pollutants and methane) and CO2M (carbon dioxide and methane). (Table 1)
A second category of space-borne methane sensors are instruments that provide targeted measurements of selected areas. These systems are purpose-built to support emissions quantification with good spatial resolution for a limited number of sites.(23) Such systems typically rely on the first category of instruments, those with full global coverage, to identify emissions hotspots and/or calibrate sensors.
Examples of the second category of satellites include those operated by GHGSat, a Canadian company that sells its methane data on commercial terms and has attracted investment from the venture fund created by the companies of the Oil and Gas Climate Initiative.(24)
In 2016, GHGSat launched its first satellite. The company is launching two follow-on satellites with improved measurement capabilities in 2020 and a larger fleet of satellites in 2022.(25) A second targeted methane monitoring initiative is the Twin Anthropogenic Greenhouse Gas Observers (TANGO) mission, which is currently being evaluated by ESA for potential implementation in 2024.
This mission could provide public data of methane and carbon dioxide emissions and could be used in tandem with the Sentinel-5 and CO2M satellites to provide more detailed examination of specific locations.(26) Another example of this category of satellites is the Methane SAT system, currently under development by the Environmental Defense Fund (EDF), a major U.S.-based environmental advocacy organization.(27)
A third category of space-based methane sensors are instruments that provide near-continuous measurements of a given part of the planet. These instruments are in a geostationary orbit 35,786 km above mean sea level (compare to typical orbits of 500-800 km for the first and second satellite categories above).
For methane observation, the most relevant mission will be the GeoCarb mission, which has been planned by NASA to provide “wall-to-wall” observations over the Americas between 50 degrees North and South latitude – from the southern tip of Hudson Bay to the southern tip of South America.(28)
Note: “Nominal detection threshold” represents the smallest leak rate a system is expected to detect and quantify. “Pixel size” is a measure of the smallest increment of Earth’s surface that the system can observe.
The ability of each satellite instrument to quantify methane emissions depends on its technical specifications (summarized as “detection threshold” in Table 1), its ability to spatially separate neighboring sources, and its ability to produce measurements in different conditions (e.g., the amount of daylight and cloud cover). Offshore methane emissions cannot be measured, or can only partly be measured, from satellite-based systems; instead, on-facility sensors and low-flying aircraft must be used.(30)
Research has shown that satellite data can be used to provide emission assessments at a national level, regional level or the level of large geographical areas. Satellites can provide valuable insights into emissions from clusters of industrial, agricultural or waste disposal activities.
In the context of the oil and gas industry, a typical example of this concerns emissions on the scale of basins, geographical areas where large numbers of well pads, pipelines and processing equipment are concentrated to produce hydrocarbons from a subsurface reservoir.
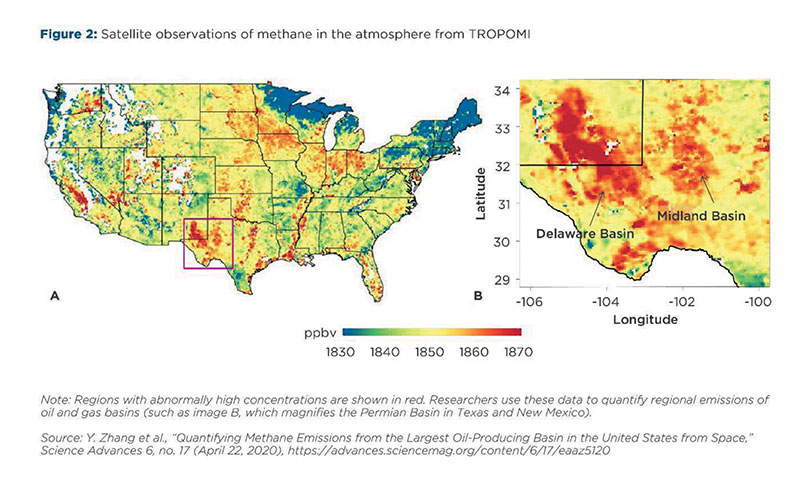
Recently, teams of scientists have used the data of TROPOMI to quantify emissions from the Permian Basin in the United States (Figure 2). The Permian accounted for about 35% of oil and 16% of gas produced in the U.S. in 2019.(31) Reported methane emissions rates are about 3 billion kilograms per year.(32) These estimates are more than a factor of two higher than estimates derived from U.S. EPA greenhouse gas inventory.(33)
Note: Regions with abnormally high concentrations are shown in red. Researchers use these data to quantify regional emissions of oil and gas basins (such as image B, which magnifies the Permian Basin in Texas and New Mexico).
National and basin-level assessments can be used by policy makers and other stakeholders to assess methane emissions reduction potential and compare reported and actual emissions.
Such assessments at present do not allow owners and operators of facilities who detect individual leaks to take specific remedial action. The precision of satellite-based assessments is expected to improve with successive generations of satellites.
Moreover, the national and basin-level assessments can serve as a tool to help identify methane hotspots, enabling the use of detailed ground or airborne measurements to find leaks and identify mitigation steps. Furthermore, national and basin assessments can help policy makers and investors assess the likely extent of emissions in areas from which little other emissions data is available.
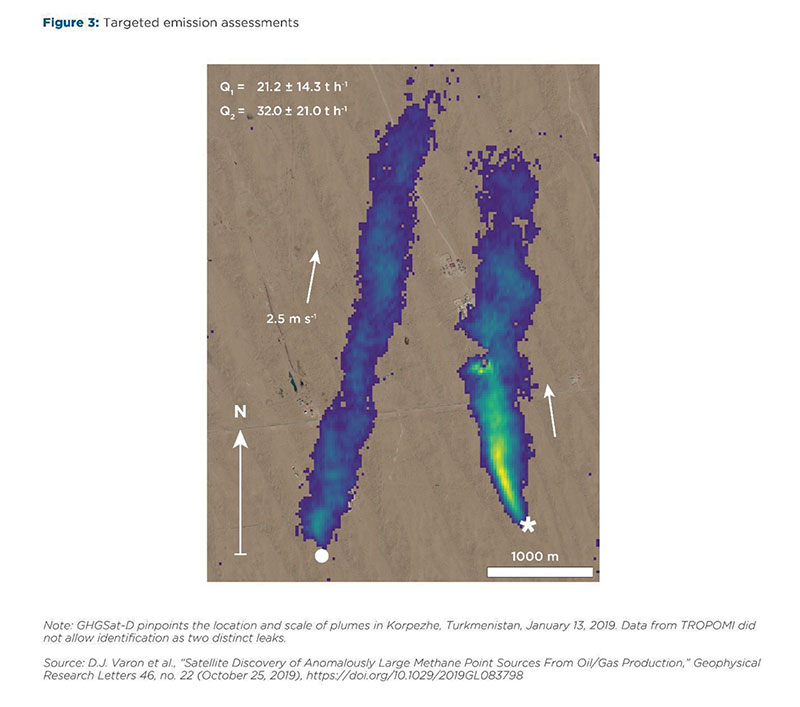
Satellites have recently become an increasingly valuable tool for quantifying individual emissions sources, and they will improve further as technical capabilities evolve. Figure 3 shows an example of how the targeted measurements of GHGSat were used to monitor emissions from a pipeline leak in the Korpezhe oil and gas field in Turkmenistan.
GHGSat data enabled identification of a leak at a gas compressor station, which was assessed to be 10,000 to 43,000 kilograms of methane per hour. Other nearby leaks were also identified, with strengths ranging from 4,000 to 32,000 kilograms per hour. Archived TROPOMI data showed large Korpezhe emissions persisted for at least 14 months.(34)
Note: GHGSat‐D pinpoints the location and scale of plumes in Korpezhe, Turkmenistan, on Jan. 13, 2019. Data from TROPOMI did not allow identification as two distinct leaks.
The ability to quantify emissions data from space is a recent development and is gaining momentum. Further technological advancements can be expected. To date, nearly all emissions assessments have been undertaken through scientific studies. A major task lies ahead to translate scientific knowledge into operational systems, validate them, and ensure frequent and reliable streams of emissions data become available for use by facility operators, investors and policy-makers.
References:
[1] R.L. Kleinberg, “The Global Warming Potential Misrepresents the Physics of Global Warming Thereby Misleading Policy Makers,” preprint (2020) https://www.researchgate.net/publication/344026808_Kleinberg_GWP_Climate_Policy_200901.
[2] Ibid.
[3] D. Shindell, et al., “Simultaneously Mitigating Near-Term Climate Change and Improving Human Health and Food Security,” Science 335 (2012): 183-189, https://science.sciencemag.org/content/335/6065/183.
[4] Kleinberg, “The Global Warming Potential Misrepresents the Physics…”
[5] E.G. Nisbet, et al., “Very Strong Atmospheric Methane Growth in the 4 Years 2014–2017: Implications for the Paris Agreement,” Global Biogeochemical Cycles 33, no. 3 (2019) https://agupubs.onlinelibrary.wiley.com/doi/full/10.1029/2018GB006009.
[6] Quirin Schiermeier, “Global Methane Levels Soar to Record High,” Nature (July 14, 2020), https://www.nature.com/articles/d41586-020-02116-8 (accessed August 17, 2020).
[7] D. Zavala-Araiza, et al., “Super-Emitters in Natural Gas Infrastructure Are Caused by Abnormal Process Conditions,” Nature Communications 8 (2017), https://www.nature.com/articles/ncomms14012.
[8] R.A. Alvarez, et al., “Assessment of Methane Emissions from the U.S. Oil and Gas Supply Chain,” Science 13 (July 2018), Supplementary Material, https://science.sciencemag.org/content/361/6398/186.
[9] EPA, “Methane Emissions from the Natural Gas Industry,” EPA/600/R-96/080a through EPA/600/R-96/080o (15 volumes) (1996).
[10] Examples of such abnormal conditions include failures of tank control systems, stuck pressure-relief valves that result in venting of methane from tanks into the atmosphere, design failures, excessive operating pressures, and malfunctioning or improperly operated equipment (Zavala-Araiza, “Super-emitters”).
[11] Alvarez, et al. found actual emissions from production, gathering, processing, and transmission to be 1.7 times larger than reported via the official inventory and did not assess emissions from natural gas distribution, oil refining or transportation. See: Alvarez, “Assessment of methane emissions” and note the references therein. For comparison to the official inventory, see EPA, “Inventory of Greenhouse Gas Emissions and Sinks, 1990-2018,” US Environmental Protection Agency, 430-R-20-002 (2020a).
[12] EPA, “EPA’s Voluntary Methane Programs for the Oil and Natural Gas Industry,” US Environmental Protection Agency (2020b), https://www.epa.gov/natural-gas-star-program.
[13] D. Lyon, et al., “Aerial Surveys of Elevated Hydrocarbon Emissions from Oil and Gas Production Sites,” Environmental Science and Technology 50 (2016): 4877-4886, https://pubs.acs.org/doi/10.1021/acs.est.6b00705.
[14] R.L. Kleinberg, “Greenhouse Gas Footprint of Oilfield Flares Accounting for Realistic Flare Gas Composition and Distribution of Flare Efficiencies,” preprint (2019), https://doi.org/10.1002/essoar.10501340.1.
[15] EDF, “Flaring: Aerial Survey Results,” PermianMAP,
https://www.permianmap.org/flaring-emissions/ (accessed September 9, 2020).
[16] C. Leyden, “Satellite data confirms Permian gas flaring is double what companies report,” EDF (2019), http://blogs.edf.org/energyexchange/2019/01/24/satellite-data-confirms-permian-gas-flaring-is-double-what-companies-report/.
[17] A.R. Brandt, et al., “Methane Leaks from Natural Gas Systems Follow Extreme Distributions,” Environmental Science and Technology 50 (2016): 12512−12520, https://pubs.acs.org/doi/10.1021/acs.est.6b04303.
[18] D. Zavala-Araiza, et al., “Reconciling divergent estimates of oil and gas methane emissions,” Proceedings of the National Academy of Sciences 112 (2015): 15597–15602, https://www.pnas.org/content/112/51/15597;
- M. Duren, et al., “California’s methane super-emitters,” Nature 575 (2019): 180-185, https://doi.org/10.1038/s41586-019-1720-3.
[19] EPA, “Oil and Natural Gas Sector: Emission Standards for New, Reconstructed, and Modified Sources, Background Technical Support Document for the Final New Source Performance Standards 40 CFR Part 60, subpart OOOOa,” US Environmental Protection Agency (May 2016), Table 9-4 for Projected Year 2020, https://beta.regulations.gov/document/EPA-HQ-OAR-2015-0216-0212.
[20] A.K. Thorpe, et al., “Methane Emissions from Underground Gas Storage in California,” Environmental Research Letters (April 15, 2020), https://iopscience.iop.org/article/10.1088/1748-9326/ab751d.
[21] S. Pandey, et al., “Satellite observations reveal extreme methane leakage from a natural gas well blowout,” Proceedings of the National Academy of Sciences 116, no. 52 (2019): 26376-26381, https://doi.org/10.1073/pnas.1908712116.
[22] Based on Kayrros processing of data from Sentinel 5-P/TROPOMI satellite. See: https://www.esa.int/Applications/Observing_the_Earth/Copernicus/Sentinel-5P/Mapping_methane_emissions_on_a_global_scale.
[23] MethaneSAT, “How it fits into the methane measurement eco-system,” MethaneSAT (2020), https://www.methanesat.org/fit-with-other-missions/; GHGSat, Satellite Imagery and Data Product Specifications - IRIS for CSA & ESA, Document No. GHG-1502-7001, 13 November 2019.
[24] OGCI, “What OGCI Climate Investments is Doing,” Oil and Gas Climate Initiative, https://oilandgasclimateinitiative.com/climate-investments/reduce-methane-emissions/ (accessed September 4, 2020).
[25] Dylan Jervis. et al., “The GHGSat-D imaging spectrometer,” Atmospheric Measurement Techniques, preprint (September 25, 2020), https://amt.copernicus.org/preprints/amt-2020-301/.
[26] TNO, “TANGO satellite: monitoring greenhouse gas emissions,” TNO (June 10, 2020), https://www.tno.nl/en/about-tno/news/2020/6/tango-satellite-monitoring-greenhouse-gas-emissions/ (accessed June 2020).
[27] S. Hamburg, “How Can Aerial Measurements Aid Methane Emissions Reduction?” (online event, Florence School of Regulation, June 1, 2020),
https://fsr.eui.eu/event/how-can-aerial-measurements-aid-methane-emissions-reduction/.
[28] NASA, “GeoCarb: A New View of Carbon Over the Americas,” NASA (January 11, 2018),
https://www.nasa.gov/feature/jpl/geocarb-a-new-view-of-carbon-over-the-americas.
[29] Table created by Kleinberg, Leemhuis, and Denier von der Gon using sources as listed here: For SCIAMACHY and TROPOMI: D. Jacob, et al., “Satellite observations of atmospheric methane and their value for quantifying methane emissions,” Atmospheric Chemistry and Physics 16, no. 22 (November 18, 2016): 14,371–14,396; for Sentinel-5 the same threshold is assumed as the TROPOMI instrument on its precursor mission Sentinel-5p; European Space Agency, “Copernicus CO2 Monitoring Mission Requirements Document,” Earth and Mission Science Division, 2019, ref. EOP-SM/3088/YM-ym.
https://esamultimedia.esa.int/docs/EarthObservation/CO2M_MRD_v2.0_Issued20190927.pdf; For the TANGO mission the minimal detection threshold is based on: TNO, “Monitoring greenhouse gas emissions,” https://www.tno.nl/en/about-tno/news/2020/6/tango-satellite-monitoring-greenhouse-gas-emissions/ (accessed October 2020); for MethaneSat, S. Hamburg, “How Can Aerial Measurements Aid Methane Emissions Reduction?”; for GHGSat, D. Jervis et al., “The GHGSat-D imaging spectrometer”; for GeoCarb, B. Moore et al., “The Potential of the Geostationary Carbon Cycle Observatory (GeoCarb) to Provide Multi-Scale Constraints on the Carbon Cycle in the Americas,” Frontiers in Environmental Science 6 (2018), https://doi.org/10.3389/fenvs.2018.00109.
[30] Alan M. Gorchov Negron, Eric A. Kort, Steven A. Conley, and Mackenzie L. Smith, “Airborne Assessment of Methane Emission from Offshore Platforms in the US Gulf of Mexico,” Environmental Science and Technology 54 (2020): 5112-5120, Supporting Information Appendix S4, https://pubs.acs.org/doi/10.1021/acs.est.0c00179.
[31] EIA, “Drilling Productivity Report,” EIA (September 14, 2020), https://www.eia.gov/petroleum/drilling/.
[32] Y. Zhang, et al., “Quantifying Methane Emissions from the Largest Oil-Producing Basin in the United States from Space,” Science Advances 6, no. 17 (April 22, 2020), https://advances.sciencemag.org/content/6/17/eaaz5120, and O. Schneising, et al., “Remote Sensing of Methane Leakage from Natural Gas and Petroleum Systems Revisited,” Atmospheric Chemistry and Physics, preprint (2020), https://doi.org/10.5194/acp-2020-274.
[33] Zhang, et al., “Quantifying Methane Émissions.”
[34] D.J. Varon, et al., “Satellite Discovery of Anomalously Large Methane Point Sources From Oil/Gas Production,” Geophysical Research Letters 46, no. 22 (October 25, 2019), https://doi.org/10.1029/2019GL083798.
Authors:
Jonathan Elkind is a senior research scholar at the Center on Global Energy Policy.
Erin Blanton is a senior research scholar at the Center on Global Energy Policy.
Hugo Denier van der Gon is a senior scientist and emissions inventory expert at the TNO Department of Climate, Air, and Sustainability.
Dr. Robert L. Kleinberg is an adjunct senior research scholar.
Anton Leemhuis manages the program for Earth Observation satellite instruments and satellite data utilization at TNO.
Editor’s note: Posted with permission by the Center on Global Energy Policy at Columbia University SIPA. tinyurl.com/CIPA-Center.


Comments