
September 2023, Vol. 250, No. 9
Features
Residual Stress in Predicted Failure Pressure Calculation—Part 2
Residual Stress in Predicted Failure Pressure Calculation—Part 2
By Michael J. Rosenfeld, Chief Engineer, RSI Pipeline Solutions LLC, and Scott Fannin, Principal Engineer, Pacific Gas & Electric Company (PG&E)
(Editor’s note: Part 1 of this article on residual stress and predicted failure on pressure calculation is appeared in the August 2023 issue of P&GJ.)
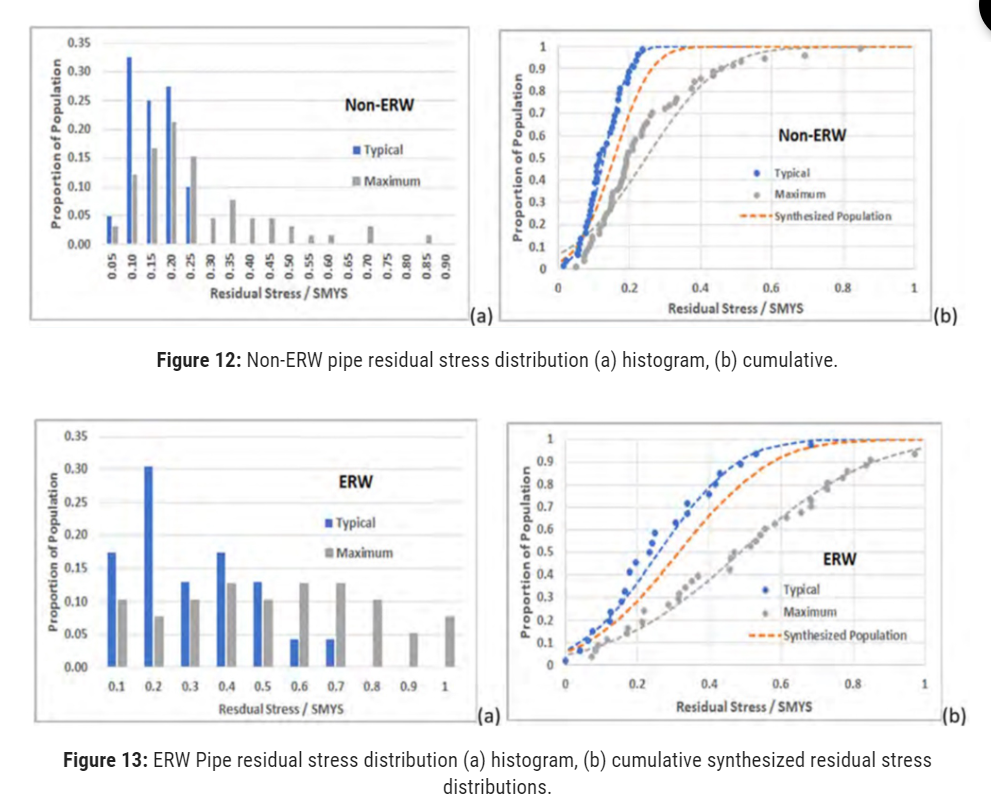
(P&GJ) — An objective was to determine residual stress values corresponding to target probabilities, such as the 90th percentile. Every reference reviewed reported maximum stress levels, but only one-third of the references presented other residual stresses as they vary with position in the pipe.
The data consisted of twice as many “maximum” values as “typical” values. They could not be combined in a single population because “maximum” values would be over-represented.
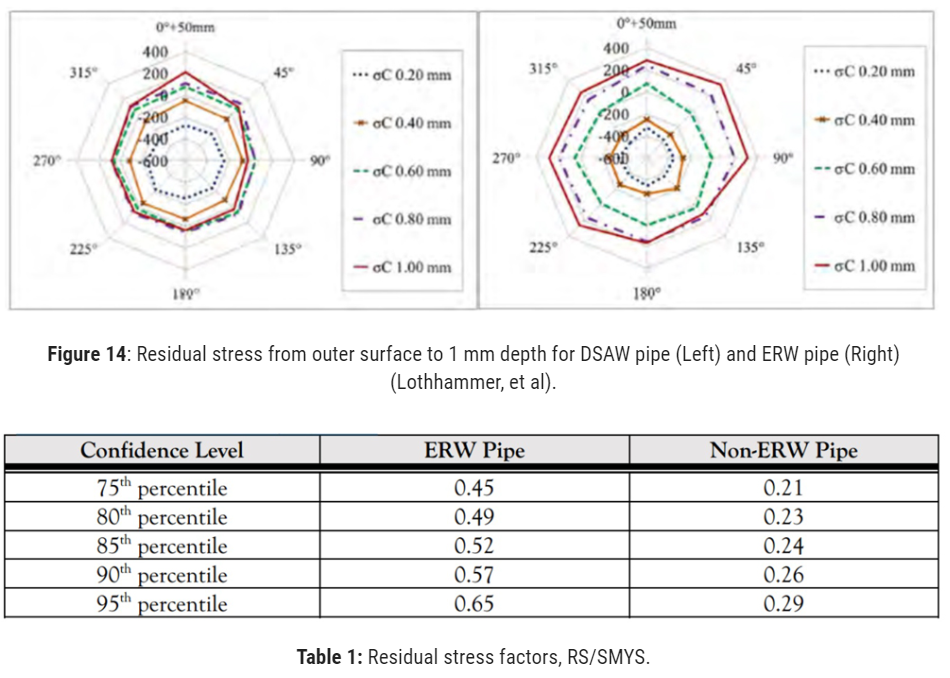
Maximum stresses are not expected to persist everywhere in the pipe. An expected pattern is that “maximum” stresses may prevail within a quadrant of the pipe cross-section (Figure 14).12
Thus “typical” values should be about three times as prevalent as “maximum” values. A synthesized cumulative distribution was defined based on weighting the “typical” population statistics by a factor of 3 relative to the “maximum” population statistics. The synthesized cumulative distributions are indicated by the orange dashed curves in Figure 12 (b) and Figure 13 (b). The RS/SMYS values corresponding to the 75th percentile to the 95th percentile for ERW and non-ERW pipe are listed (Table 1).
Effect of Residual Stresses on Failure Pressure NG-18 Report 104.
Report 10413 was the only study identified that experimentally determined the effect of residual stress on the failure pressure of a pipe containing a defect. The tests and results are discussed below.
In the first series of tests, two lengths of otherwise similar pipe (1945 24-inch OD x 0.281-inch NWT, Grade X50, flash-welded seam pipe) were modified to introduce very high residual circumferential stress.
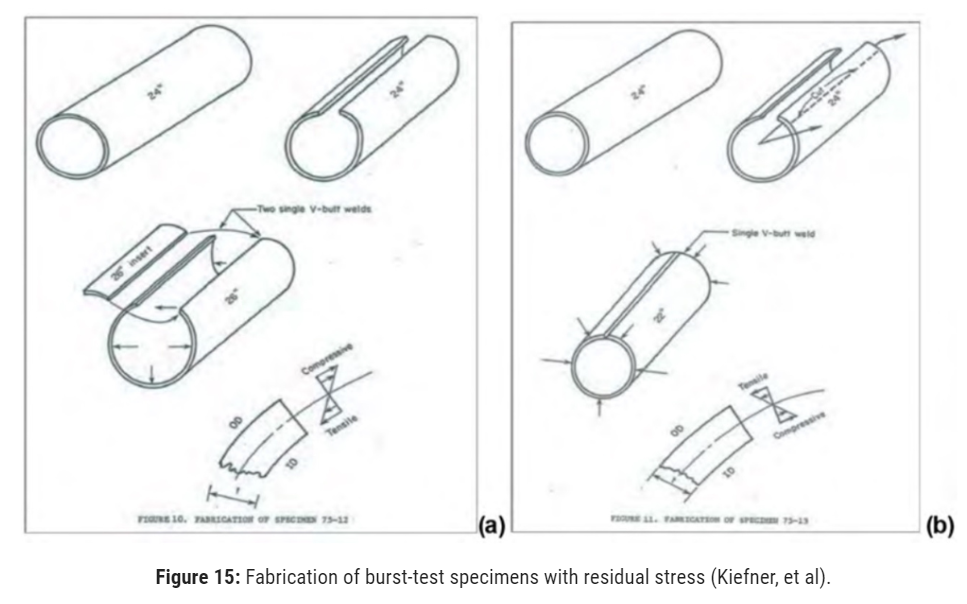
The material had actual yield strength of 58.4 ksi and equivalent full-sized CVN impact energy of 36 ft-lb. Specimen 75-12 was slitted lengthwise, and a 6.5-inch strip of extra material was inserted and welded into the gap to produce a compressive residual stress on the OD surface of about 23% SMYS.
Specimen 75-13 was fabricated by cutting out an 8.5-inch-wide longitudinal strip and then forcing the gap closed and rewelding to produce a residual tensile stress on the OD surface of approximately 48% SMYS. The fabrication of these special samples is illustrated in Figure 15(a) and (b). Each sample was prepared with the same-sized notch machined on the OD surface, and then was pressure tested to failure.
The specially fabricated samples exhibited only small effects of the residual stress. The failure pressures were within 5% of what would have been expected with zero residual, calculated using MAT-8, despite the large residual stresses, most likely due to the failures being flow-stress dependent.
Another series of tests was performed using 36-inch OD x 0.450-inch NWT pipe specially made in 1972 as quenched and tempered Grade X100. The actual yield strength was 115.7 ksi and the equivalent full-size CVN absorbed impact energy was 15.75 ft-lb. The pipe was formed by the UO process without expansion.
The quenching was from the exterior side so the pipe had a large residual stress estimated from a single ring test to be around -6 ksi (compressive such that a slit ring would tend to close). Samples with differing amounts of residual stress were created by hydrostatic pressure testing to differing levels. The sample tested to a hoop stress of 90% SMYS exhibited a residual compressive stress of -33% SMYS, after a pressure test to actual yielding at a hoop stress of 114% SMYS, it exhibited a residual compressive stress of -13% SMYS.
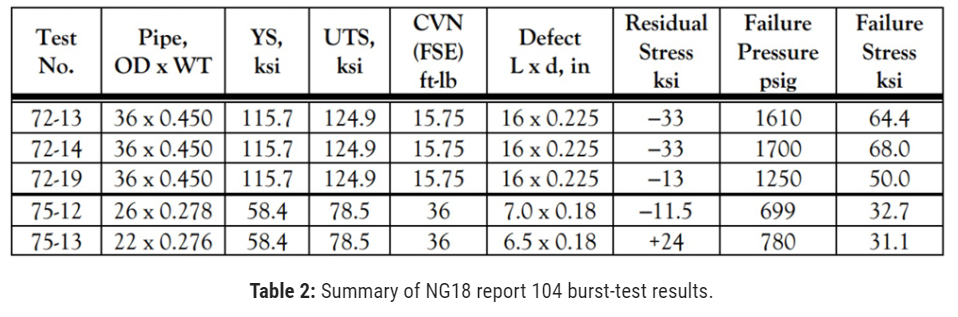
Specimens 72-13 and 72-4 with -33% SMYS residual stress and Specimen 72-19 with -13% SMYS were prepared with identical notches and then were then burst tested. Specimens 72-13 and 72-14 failed at stresses of 64.4 ksi and 68 ksi; specimen 72-19 failed at a stress of 50 ksi.
The combination of defect length and impact toughness were well within the regime of toughness-controlled behavior, but the failure pressures were much higher than would be expected without residual stress.
The inward bulging due to the through-wall residual stress was thought to have played a role by delaying outward bulging that usually occurs in a pressurized cylinder with a discontinuity. The residual stresses are through-wall bending. The presence of a discontinuity (a crack) partially relieves the residual stress, but at the cost of increased crack-opening displacement.
The tensile residual stress in specimen 75-3 had little effect on the outcome due to the ability of the ductile material to tolerate the additional crack-opening displacement as stresses in the net section redistribute.
A summary of the results of the tests is provided in Table 2. Note that only one of the five tests, number 75-13, had a known tensile stress acting on the pipe OD surface, and this was the only known test designed to evaluate the effect of a tensile residual stress on the burst pressure.
Residual Stress
The test cases were evaluated using MAT-or the Modified Ln-Secant (MLS) equation. The version of MAT-8 used does not consider compressive residual stresses, only zero or tensile residual stresses.
The residual stresses are through-wall bending which are accounted for in the FEA-based formulation. (Residual stress can vary around the pipe circumference. From a practical standpoint an operator would not know whether a residual stress acting on a defect in a subject pipe is tensile or compressive, so assuming that it is always tensile would be prudent.)
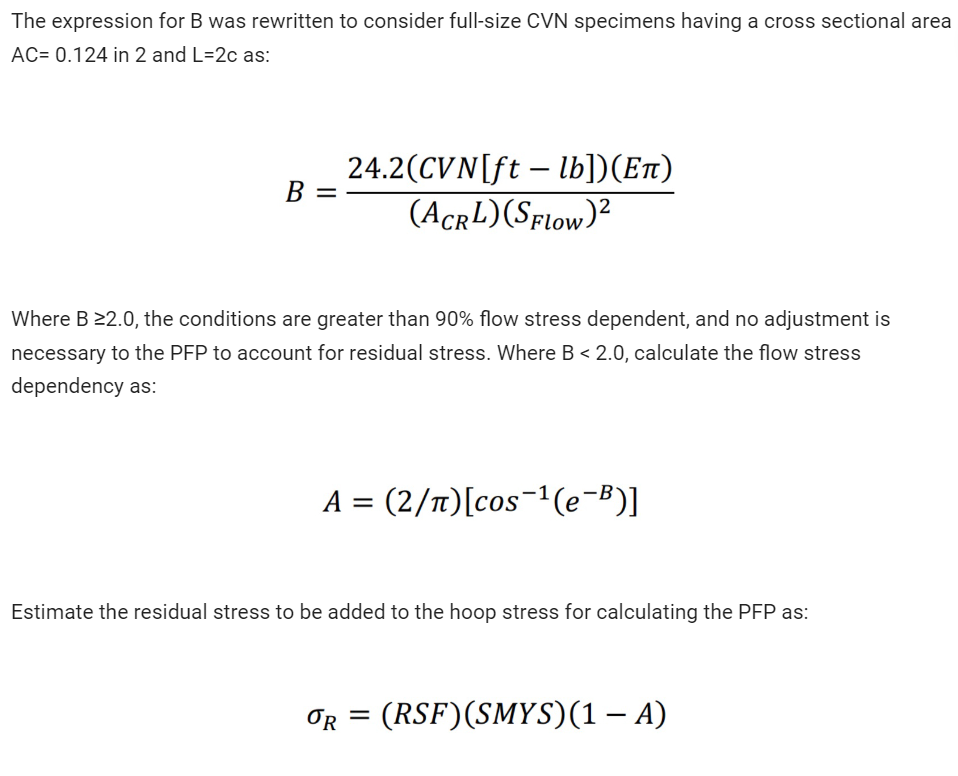
The MLS was not developed to account for through-wall tensile or compressive residual stresses, but a process was developed to estimate the residual stresses to apply as an added or subtracted stress value.
The results of the flow-stress-dependent Tests 75-12 and 75-13 showed very little evidence of very large tensile or compressive residual stresses, but toughness-dependent tests showed a significant effect of the compressive residual stresses, but not as much as simply adding a pressure commensurate with the residual compressive stresses to the applied pressure). (Figure 16).
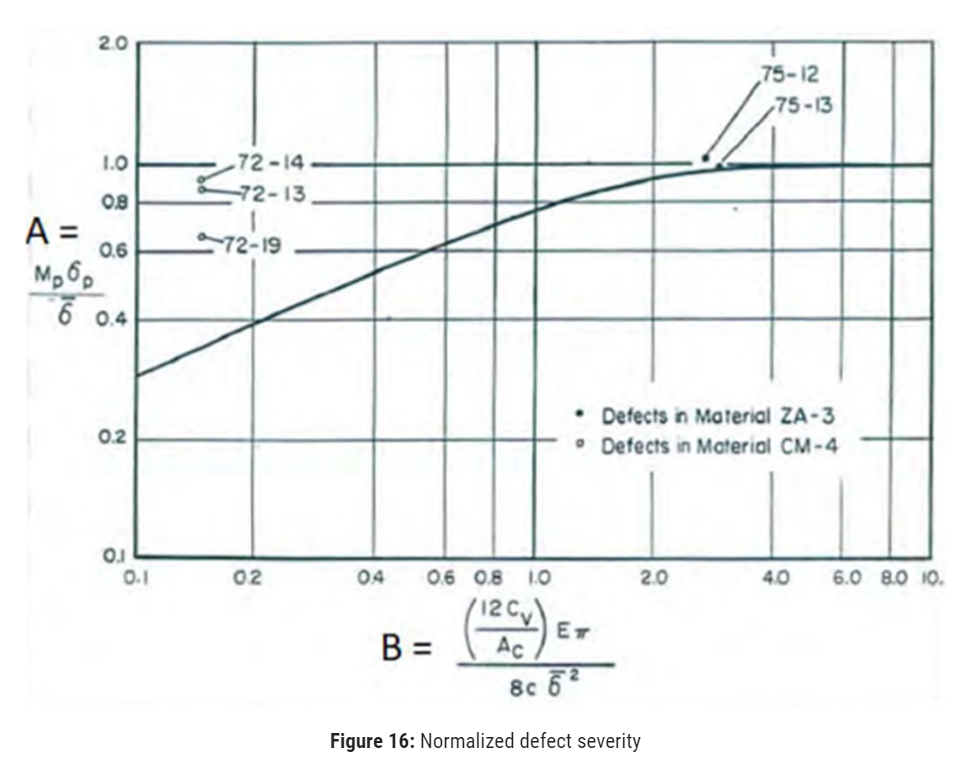
The curve represents the original NG-18 Ln-Secant equation relationship between the normalized failure stress (“A”) and the normalized defect severity (“B”). The extent to which the curve lies below A = 1.0 reflects the toughness dependency. B decreases with decreasing CVN toughness or with increasing defect length (‘c’ in the denominator is equal to half the defect length). Where B > 2.0, the combination of CVN impact energy and defect length is such that the failure stress is dependent almost entirely on flow stress. Greater toughness does not increase the failure stress.
The two tests 75-12 and 75-13 are well into that range of behavior and lie very close to the expected behavior represented by the curve, despite large residual stresses. The results for tests 72-13, 72-14, and 72-19 are seen in Figure 16 to be significantly less toughness-dependent than would be expected without residual stress.
The residual stress factors are chosen to correspond to the seam type and confidence level listed in Table 1. This will de-emphasize the residual stress for strength-dependent conditions. Note that the 1-A adjustment should only be applied when using the MLS equation, not with MAT-8.With MAT-8, API 579 Level 2, or another method capable of accounting for the through-wall bending component of residual stress, consider the residual stress to be:

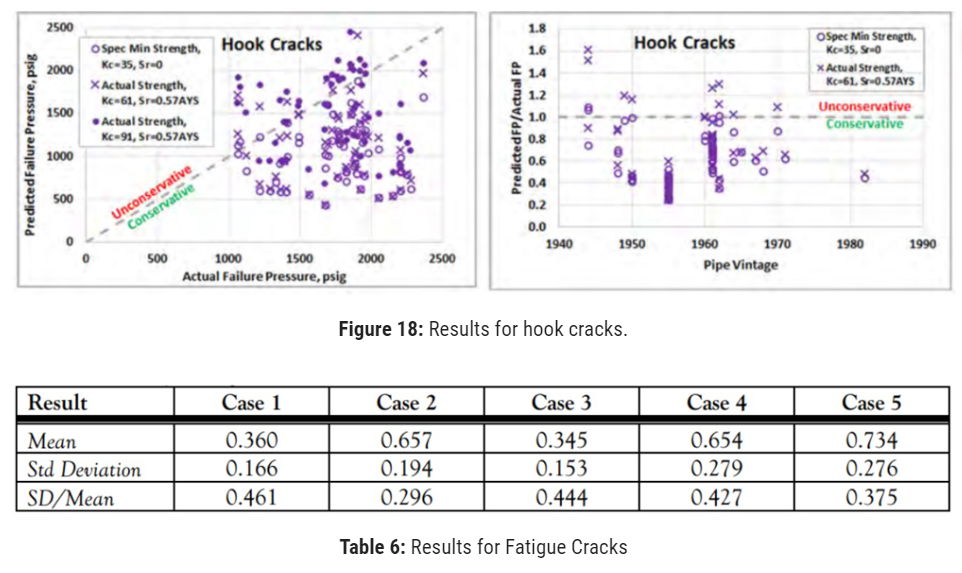
The PHMSA ERW seam R&D study, Tasks 1.4 14 and 2.4 15, compiled failures in ERW and FW seams and sorted them by cause. Most were categorized as cold welds (CW), hook cracks (HC), fatigue-enlarged cracks16 (FC) or selective seam weld corrosion (SSWC). These features were useful because they included failure pressures, defect sizes, actual strengths, and CVN toughness at the upper shelf.
The effect of considering residual stress on the predicted failure pressure was evaluated by considering differing evaluation inputs of strength, toughness, and residual stress and comparing the predicted failure pressure to the actual failure pressure. MAT-8 was used for the calculations.
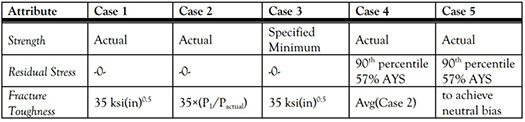
Case 3 relying on specified minimum strength properties and minimal fracture toughness might be the base choice for an operator’s assessment since actual strength and actual fracture toughness properties would often not be known. Cases 4 and 5 assumed a residual stress corresponding to the 90th percentile level for ERW pipe of 57% of the yield strength, from Table 1 along with plausible levels of fracture toughness.
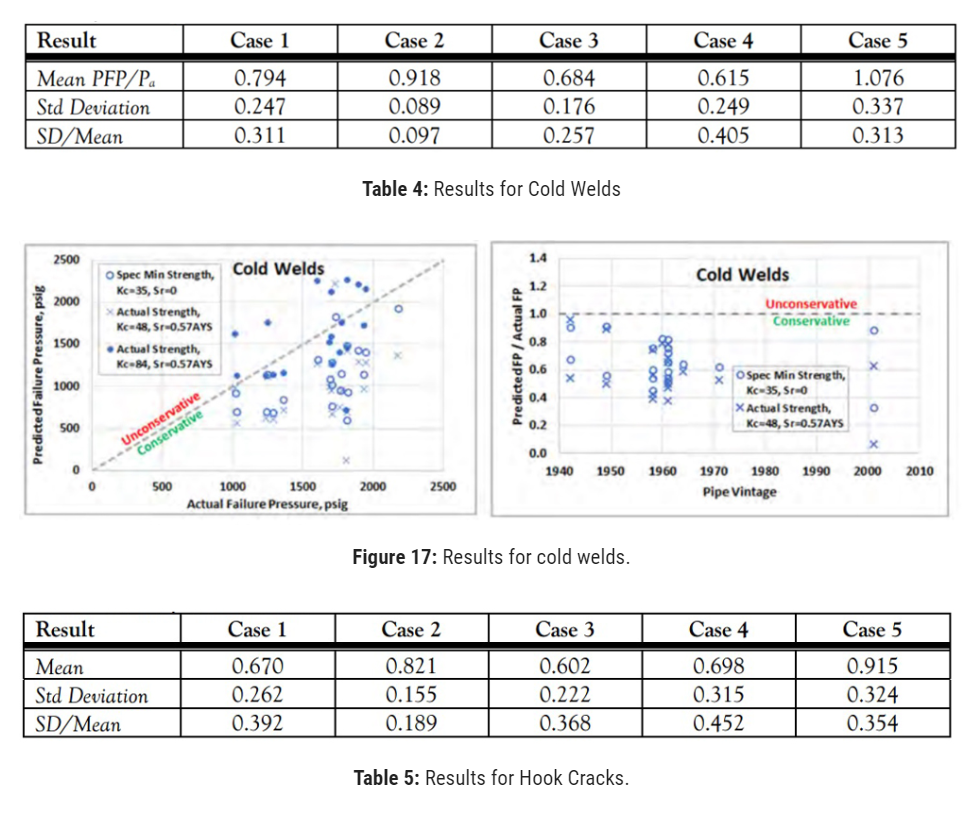
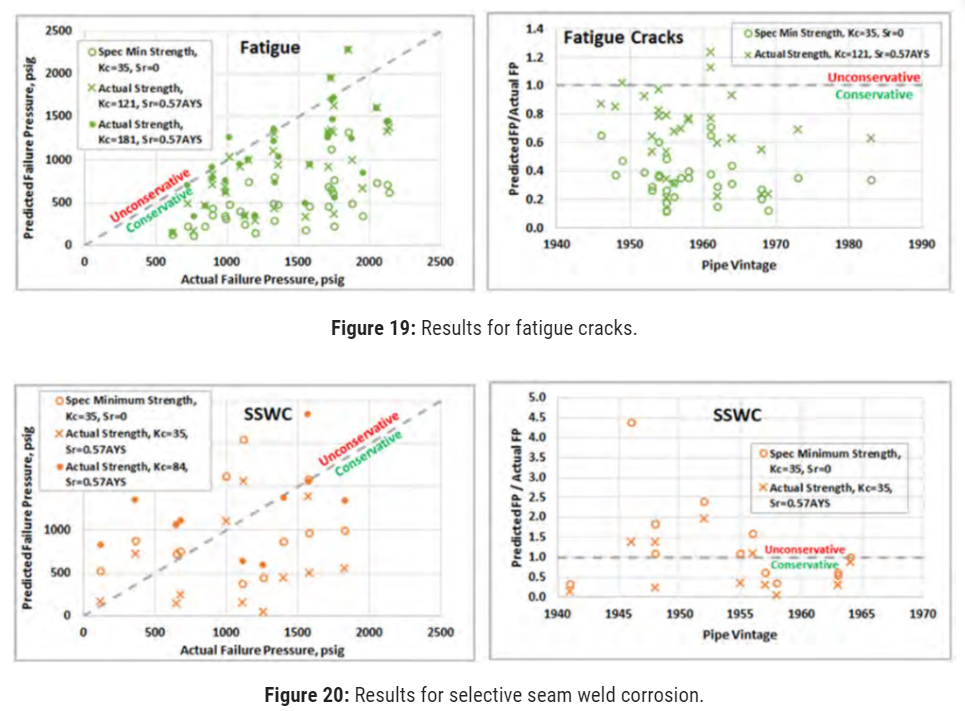
The results are summarized for each defect category in Table 4 through Table 7. “Mean PFP/Pa” refers to the mean ratio of predicted failure pressure (PFP) to actual failure pressure, Pa and is an indicator of how conservative (or not) the analysis case was. Results are also presented in Figure 17 through Figure 20, as unity charts of predicted vs. actual failure pressures for Cases 3, 4, and 5, and by PFP/Paratio vs. pipe vintage on the right.
The cold welds, hook cracks, and fatigue cracks were all conservatively predicted by the base Case 3.
In all cases, assuming residual stress slightly increased conservatism but did not reduce scatter. The only way to improve both accuracy and precision was to apply more appropriate fracture toughness values on a case-by-case basis (Case 2), which is not generally possible in a typical pipeline assessment circumstance.
The degree of conservativeness in the results tended to decrease with older vintages. It is noted that it was difficult to force the results to be unconservative for vintages more recent than 1966, which was the last year before API 5L and 5LX required post-weld heat treatment (PWHT) to eliminate hard microstructures.
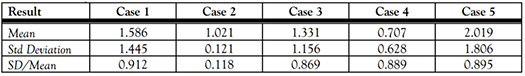
Most manufacturers were practicing PWHT before that date. The SSWC exhibited different behavior from the other categories. The scatter was larger, and a large proportion of the results were unconservative even when assuming low fracture toughness.
Assuming a residual stress reduced the extent of unconservative results but did not eliminate them in pipe vintages earlier than 1960.
Overall Findings
The results from the literature review established that residual stresses are present in all line pipe, regardless of pipe type, pipe vintage, mill test pressure, or commissioning hydrostatic test pressure.
They do not all have the same residual stresses; ERW and FW pipe tend to have greater residual stresses than other pipe types. Also, ERW seams that have been subjected to PWHT tend to have lower residual stresses than the pipe body.
Testing and experience have demonstrated that failure pressures of pipe that can exhibit ductile fracture initiation is unaffected by the inherent residual stresses from the standpoint of failure prediction. This applies to corrosion and to crack-like defects.
It appears that pipe that was not subjected to PWHT could be affected by residual stress, but if the fracture toughness is assumed to be sufficiently low (KC of 35 ksi (in) 0.5 or CVN of 4 ft-lb) residual stress need not be considered for most defects. An exception is SSWC in pipe made before 1960. There appears to be a high risk of making unconservative estimates of the failure pressure even when assuming a low fracture toughness and residual stress.17
Also, the database of actual failures is informative, but consideration should be given to the effect of sample size and the scatter exhibited by the sample data.
Decision Process
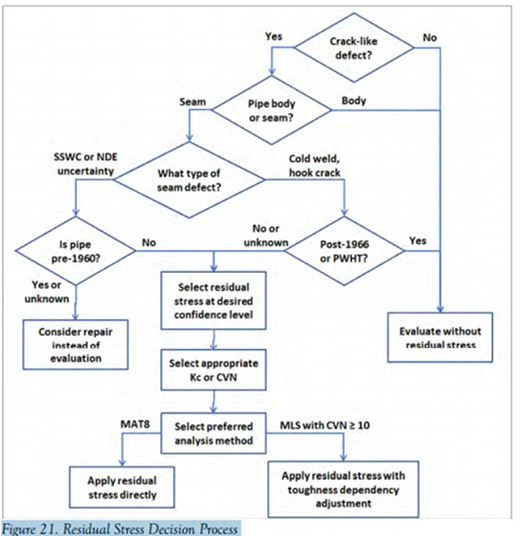
Based on the data reviewed, a residual stress decision process can be tentatively proposed (Figure 21). The first criteria are whether the defect is crack-like and in the pipe body or seam. If it is not crack-like, or it is in the pipe body, then residual stress need not be considered.18
If the defect type is a cold weld or hook crack in an ERW seam that has been subjected to PWHT, it is unnecessary to consider residual stress, unless the operator elects to do so in an abundance of caution. If the seam has not been subjected to PWHT or the status is unknown, then the operator should select the residual stress factor corresponding to the desired confidence level from Table 1.
If the defect is SSWC, or is of an uncertain nature19, and the pipe is pre-1960 vintage, consideration should be given to repairing the pipe instead of attempting to predict a failure pressure. If the defect does not fit that disqualification, then the operator should select the residual stress factor corresponding to the desired confidence level from Table 1.
The operator should next decide what fracture toughness to assume, either based on line-specific data, or the default values set forth in regulations, or based on some other rationale. The operator should then select a preferred defect evaluation method.
If the MAT-8 method is selected, the residual stress previously selected should be applied as direct input in the fracture input sheet. If the MLS equation is selected and the CVN absorbed impact energy is at least 10 ft-lb, the residual stress previously selected should be adjusted for the toughness dependency as described earlier.
There are several ways to determine whether an ERW seam has been subjected to PWHT:
- The pipe was manufactured to API 5L or 5LX after 1966.
- Procurement documents or an authoritative reference20state that the pipe was subjected to PWHT even if it was pre-1967, and sound engineering judgment shows that the pipe in question corresponds to what is described in the documents.
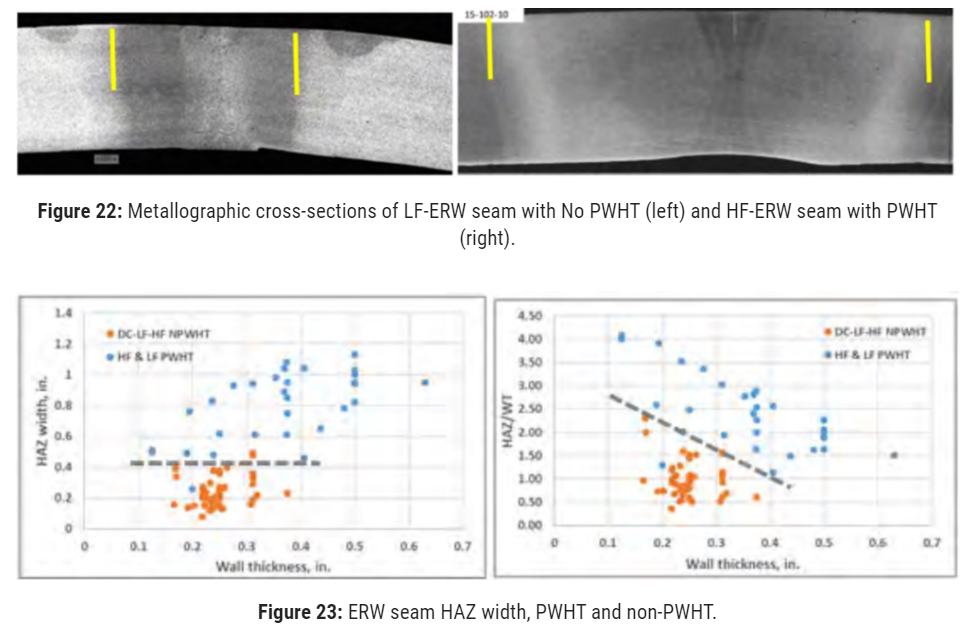
- A metallographic cross section, e.g., (Figure 22), or microhardness map of the weld cross-section of related pipe shows a heat-affected zone (HAZ) from PWHT.
- A microhardness traverse across the seam shows an absence of elevated hardness levels.21
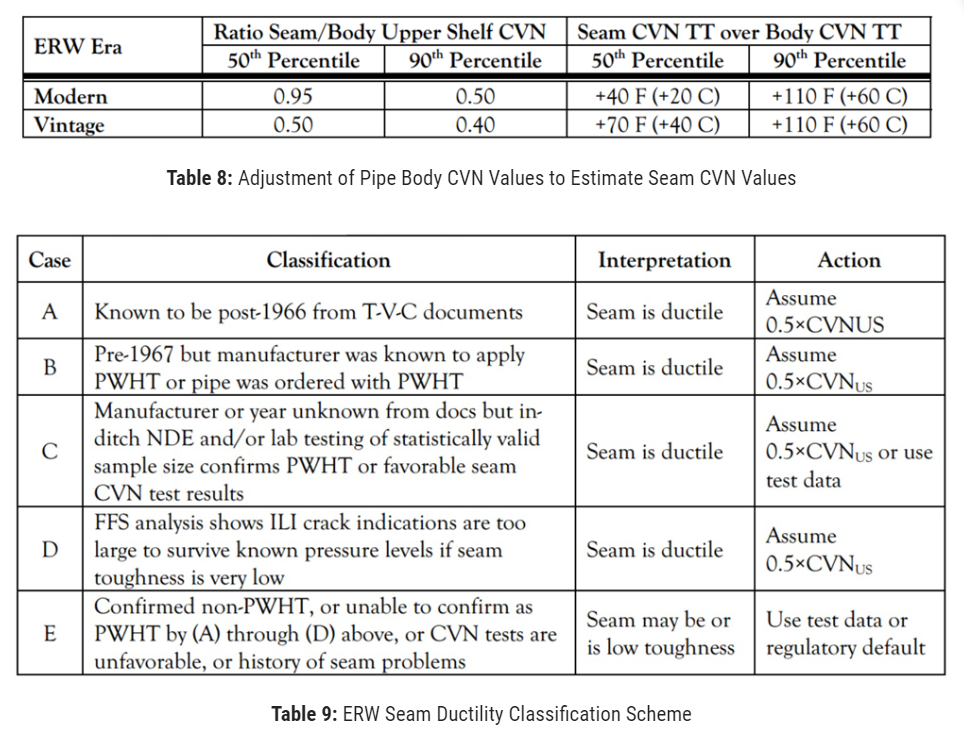
- The width of the seam HAZ observed on the polished and etched OD surface is consistent with PWHT, e.g., (Figure 23).
The industry is currently developing data bases and statistical approaches to classifying appropriate fracture toughness levels for ERW seams.22 Many pipeline operators currently only have pipe body CVN data. A review of ERW seam CVN data suggests the following adjustments to the upper shelf absorbed impact energy and transition temperatures (TT) of pipe body data to obtain an estimate of values appropriate to the ERW seam, Table 8 and seam ductility classification scheme (Table 9).23
In Table 8, “Modern” refers to pipe manufacture in 1970 or later, although this is not necessarily a bright line. (The TT shifts in Table 8 are approximate and have been rounded after conversion to degrees C.)
Acknowledgment: The authors wish to thank Pacific Gas & Electric Company for their generous support of the presented work.
Editor’s note: This paper was presented at the 36th Pipeline Pigging & Integrity Management Conference, Feb. 12-6, 2023. © Clarion Technical Conferences and Great Southern Press. Used with permission. DOI Number: 10.52202/068696-0055
References:
- Kiefner, J.F., Maxey, W.A., Wilkowski, G.M., and Eiber, R.J., “The Magnitude and Effects of Residual Stresses in Line Pipe”, A.G.A. NG-18 Report 104, Jan. 14, 1977.
- Lothhammer, L.R., Viotto, M.R., Albertazzi, Jr., A., and Veiga, C.L.N., “Residual Stress Measurements in Steel Pipes Using DSPI and the Hole-Drilling Technique”, International Journal of Pressure Vessels and Piping 152, 2017.
- Op. cit. Kiefner, et al.
- Kiefner, J.F., and Kolovich, K.M., “ERW and Flash Weld Seam Failures”, Subtask 1.4, US DOT, DTPH56-11-00003, September 24, 2012.
- Kiefner, J.F., and Kolovich, K.M., “Models for Predicting Failure Stress Levels for Defects Affecting ERW and Flash-Welded Seams, Subtask 2.4, US DOT, DTPH56-11-00003, January 3, 2013.
- The fatigue cracks originated predominately (28 of 37) from hook cracks, with 6 from mismatched plate edges and 3 from other conditions. Nearly all propagated in parent metal.
- This does not even consider the difficulties of making accurate depth measurements in SSWC. environmental cracks have been observed in the destructive examination of some SSWC features, and the usually corroded pipe surface adjacent to the SSWC may interfere with reliable defect sizing even with advanced ultrasonic examination.
- This study did not evaluate the behavior of single or double submerged-arc-welded seams. Such seams, especially in vintages before 1960, often contained hot cracks and other defects, but were not known for particularly problematic behavior as contemporaneous ERW seams were.
- An example is where the NDE cannot ascertain the length or depth or cannot determine whether it is at the OD or ID surface. Sizing difficulties could indicate another embedded defect in close proximity or some other complexity that does not lend itself to reliable sizing or evaluation.
- For example, Kiefner & Clark, History of Line Pipe Manufacturing, op. cit.
- Palkovic, S., Patel, P., Loaliyan, S.S., Islam, M., and Bellamare, S., “Nondestructive Classification of LF, HF, and HF-Normalized Electric-Resistance-Welded (ERW) Longitudinal Seams”, Pipeline Pigging and Integrity Management Conference, Houston, 2019.
- Bagnoli, K., et al, “Fracture Toughness Evaluation of Pre-1980’s Electric Resistance Welded Pipeline Seam Welds”, ASME, 14th International Pipeline Conference, Paper IPC2022-86014, Calgary, 2022.
- Rosenfeld, M.J., “Considerations for Applying §192.712 When You have No Toughness Data”, Elevara Pipeline Cracking Forum, Houston, July 15, 2021.

Comments