
February 2024, Vol. 251, No. 2
Features
Case Study: Identification, Sizing Accuracy for UTCD In-Line Inspection
By Ahmad Al Saif, Pipeline Engineer, Nauman Tehsin, Pipelines Lead Engineer, and Mohammed Al Rabeeah, Senior Pipelines Engineer, Saudi Arabia Oil Company
(P&GJ) — One of the most pressing concerns for operators of liquid buried pipelines is the management of stress corrosion cracking (SCC). Detecting and sizing SCC in liquid pipelines is usually accomplished through ultrasonic crack detection (UTCD) in-line inspection tools.
Although the UT technology was established in the industry a long time, the data remains complex to analyze and interpret. Unlike the magnetic flux leakage (MFL) tools, the accuracy of crack identification and sizing by UTCD tools has high sensitivity to temperature, pipe roughness and debris content.
However, accuracy can be enhanced by calibrating the tool after conducting some verification digs and providing the field data (i.e., crack depth, crack length), to the ILI service provider.
This article will review a challenging case study for one of Saudi Aramco’s liquid pipelines that experienced a significant increase in number of the reported crack features between two UTCD ILI runs. The pipeline was inspected by the same UTCD technology in two consecutive years. Yet, the latter run reported a significantly higher number of cracks compared with the first one.
Since cracks are not normally initiated within a one-year span, a systematic approach was followed in order to identify all potential root cause of this increase. Before identifying the cause, it was deemed necessary to verify newly reported cracks in the field.
Therefore, the quality of the recent UTCD run was established based on two criteria: a comparison of recent UTCD data with field results, followed by a comparison with raw data from a recent UTCD run with the previous UTCD run. The resulting comprehensive assessment found latter run was below the performance specifications, and hence below the acceptable limits as per API-1163.
Background
Saudi Aramco owns a 94-mile (152-km) pipeline that transports Arab light sweet crude, which consists of three sections constructed at different times. Two sections, constructed between 1947 and 1956, were coated with tape-wrap, while the third section was constructed in 1984 and coated with fusion bond epoxy (FBE). The girth welds were coated with heat shrink sleeves.
The pipeline is operating at temperature range of 100.4-122 degrees F (38-50 degrees C) and at stress level of ≥30% specified minimum yield (SMYS). Additionally, the pipeline is located in the Sabkha area, which is an area of coastal flatlands, subject to periodic flooding.
Combining all of these factors: aged infrastructure, tape-wrap coating, and operations taking place at high temperature levels and high stress levels, this pipeline would be highly susceptible to SCC, according to API-1176 SCC susceptibility ranking factors.
As a result, Saudi Aramco conducted two UTCD ILI runs in two successive years. The results of the second UTCD ILI run revealed a significant increase of the crack-like and crack-field features. Consequently, a multi-disciplinary team collaboratively compiled an enormous amount of work to identify all possible causes of this sudden increase.
Methodology
Due to the critical nature of the pipeline, Saudi Aramco agreed with the ILI vendor to share the details of all joint cracks that had a depth sizing of ≥2 mm at the time of discovery, rather than waiting until the entire preliminary report is submitted.
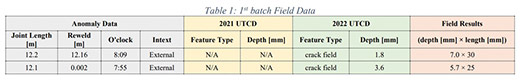
Thus, soon after receiving the first batch of the recent UTCD report, two joints were excavated to verify the ILI data. Magnetic particle inspection (MPI) was conducted to visualize the crack and measure the length of the crack. Also, UT phased-array inspection was conducted measure the depth of the cracks. The deepest crack was 7 mm, compared with 1.8 mm as per the UTCD report (Table 1).
The root cause analysis was carried out by the ILI vendor to investigate all possible reasons of under-sizing. The root cause was misclassification due to existence of enormous number of mill anomalies, which made the characterization of cracks quite challenging.
The ILI vendor conducted a re-evaluation on the ILI data and identified an additional 34 cracks with ILI reported depth of 2 mm or greater. Based on the urgency of the discovery, Saudi Aramco excavated these locations and conducted NDT examinations (MPI, UT shear wave, and UT phased array) to verify the ILI data.
All external reported cracks were positively found in the field. The majority of the heat affected zone (HAZ) cracks were undersized in comparison with the actual field data. In the following section, the actual certainty of the run is calculated based on the internationally known practice as per API-1163 standard.
Run Performance
After conducting the field inspections on 92 of the reported cracks by the UTCD ILI run, a statistical analysis was carried out to validate the ILI run in order to verify whether the tool’s actual performance in this pipeline is within the tool’s claimed specifications or not. API-1163 standard is one of the most commonly used standard to validate ILI runs and will be followed in this article.
Evaluating Probability
POD and POFR were calculated in accordance with API-1163 (2021 version). For a sample of 92 excavated and reported cracks, the POF and POFC are:
- POD = 1
- POFR = 42%
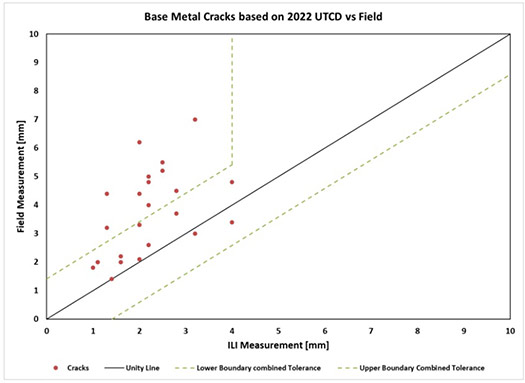
The main purpose of evaluating the probability of sizing (POS) is to validate the tool’s performance specifications. The unity graph below shows the field vs ILI measurements, if the sizing tolerance bars for any given point touch or intersect the unity line, the ILI measurement is considered within tolerance.
Figure 1 shows the unity chart of field vs. ILI depth sizing. Only 12 out of 23 evaluated cracks were within the tool’s tolerance.
Confidence Bounds
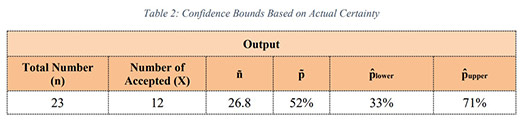
For this pipeline, 23 cracks were inspected and measured in the field for ILI validation (n = 23) and 12 of them are within the ILI tolerance (X=12). Therefore, the actual certainty is within confidence interval (0.33, 0.71), and the ILI vendor’s certainty is 80% at 95% confidence. Therefore, the observed ILI sizing certainty is lower than stated certainty.
Note: the tolerances of field technologies were implemented as follows:
- ±1 mm for UT shear wave
- ± 0.4 mm for phased array
Linear Indications
HAZ was known to have a width of 20 mm around the girth weld from both sides and the reported cracks in this region have reduced sizing accuracy due to sensor liftoff. The UTCD ILI tool was significantly under-sizing the reported cracks (field depth is higher than ILI depth).
From 10 excavated cracks at HAZ, the average difference between ILI and field depth was 3.9 mm. Although these cracks are not part of the validation of the ILI run, they will receive special attention during the repair as they represent severe integrity threats to the pipeline.
This pipeline has multiple challenges making the integrity condition assessment more difficult. One of these challenges: the several cracks found in the field have extremely similar signals to mill anomalies in the UTCD tool. That is multiple mill anomalies found in the field have very similar signals cracks.
This is one major challenge experienced by the ILI vendor in the characterization stage. Also, almost 22 cracks were found with small length (L<25mm) with high depth sometimes. Hence, all of these cracks are below the performance specifications of the UTCD tool.
A third challenge was that several of the reported and found cracks fall at the HAZ zone (both girth weld and seam weld areas). With that in mind, the ILI vendor had to analyze an enormous amount of data below the UTCD performance specifications.
This resulted in exposing locations that do not have real cracks. At the same time, not considering these ILI indications might cause the integrity team to overlook severely deep and short cracks. It is worth mentioning that conducting a re-run would not produce more confident results about the cracks, unless a significant growth is encountered between the two ILI runs.
Crack Initiation
After confirming the reported cracks by 2022 ILI run in the field, the ILI vendor was requested to review the 2021 UTCD signal responses to verify their existence at that run. All of these cracks were clearly visible in the 2021 UTCD run. With that, it is confirmed that these cracks did not initiate in one-year period. In fact, several were below the minimum reporting threshold and others were classified as inclusions or mill defects.
Conclusion
Inspecting aged pipelines might become a seriously challenging task for both the ILI vendor and the pipeline operator. In particular, pipelines that were constructed prior to 1970s due to the limited technologies in piping manufacturing and coating type.
Therefore, achieving 80% certainty, according to API-1163, might not be feasible option. Yet, the UTCD data can be utilized to attend reported cracks. Last but not least, under-performance linear indications are major challenge to the current crack ILI technologies.
Acknowledgments: Special gratitude goes to the ILI vendor team members and our colleagues operation and inspection teams at Saudi Aramco, who spared no effort to report and attend all of these indications which enabled us to technically evaluate the ILI data.
References:
API-1163, 2021: In-line Inspection Systems Qualification
POF-100, 2021: Specifications and Requirements for In-Line Inspection of Pipelines
API-1176, 2022: Recommended Practice for Assessment and Management of Cracking in Pipelines

Comments