
February 2014, Vol. 241 No. 2
Features
Measuring Uptime Of A SCADA System
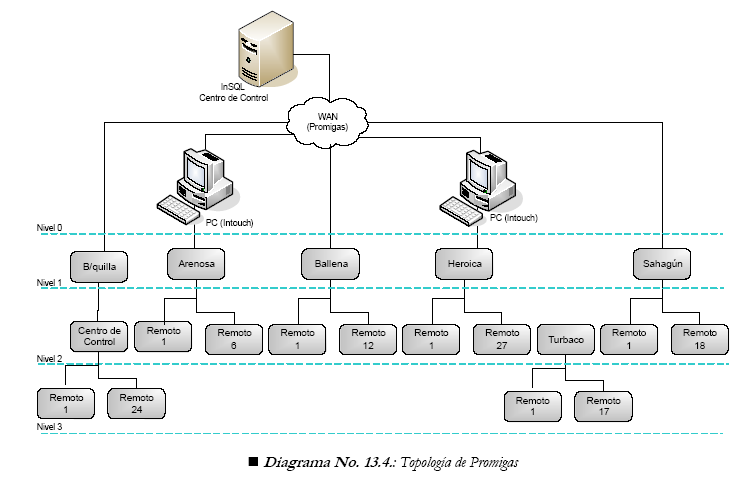
Promigas is a natural gas transportation company on the Atlantic coast of Colombia that, on average, transports 0.3 Bcf/d and may reach 0.6 Bcf/d at peak times. Its system consists of pipes ranging from 1-inch to 32-inch diameter with four entry points and 330 exit points, serving about 6.2 million homes.
The system is monitored and controlled by a SCADA using Wonderware’s HMI (Intouch 9.x). Of the exit points, 96% may be seen from the control center. Most of the RTU and flow computers are of the Bristol Backcock (BB) type (Figure 1).
The telemetry information is transmitted through a privately owned radio network (four boosters), and other means, most of which converge in a corporate network.
The maintenance of the entire infrastructure is done through the SAP PM Module, issuing work orders (OT) to the maintenance teams which are controlled on a monthly basis with indicators specific to this kind of activities. Some years ago, the transition from a prescriptive maintenance system to a condition-based system was made and as a result many preventive inspection and maintenance tasks could be eliminated.
Still, the company has always wanted to effectively measure the management of the work teams. One way is to evaluate how many OT were executed every month compared to the planned amount, which were related to industry standards allowing for acceptable system uptime.
Promigas quickly realized that although this is a common way to control the system, it could be improved through a simpler approach: directly measuring the system uptime. That is, the time during which the operators in the control center (end users) have real-time, reliable and accurate information of the operation of the transportation system.
This alone is a complex task due to the amount of calculations needed each month or during some other defined time frame. But what if we made it even more challenging, and think in real-time using an online indicator that showed at the end of the day what has been the system’s uptime per node, concentrator (influence area) and, even better, the entire SCADA system?
It seemed complicated, but in the end it required a simple implementation that may be replicated by any similar monitoring system network. This is one of the main management indicators controlled in the operations of the Promigas system.
Indicator Calculation
The system uptime cay be calculated from the uptime of each individual component and then, with the application of certain criterion, to calculate a weighted incidence on how the individual uptime will have an effect on the general uptime. In basic terms, the similarity to a tree-type topological structure is used to explain the impact of the individual components’ uptime in the total uptime of the system. This way, elements located in the leaves and branches have an impact on the uptime of the tree system.
Basically, the uptime indicator for distributed systems is calculated independently for each component of the system, and then a weighted average is made (the most simple case consists of the assumption that every element has equal importance or incidence, for instance, value of 1.)
In the case of distributed structure SCADA systems, the data concentrators are the elements that group the information from remote elements under diverse types of criteria, such as geographical distribution, the type of the communication link and the control strategy, becoming yet another uptime component.
For Promigas, the following individual sources of uptime were identified:
• Communication links between the data concentrator and each remote
• Data concentrator uptime
Figure 2: SCADA topology in the software application.
In the SCADA topology (Figure 2) in the software application, the folders on the left represent concentrators with the remotes are attached to them. For instance, the remotes of “Kennedy” and “Arenosa” are shown. Since there are a fixed number of pollings per day for each remote or concentrator, the indicator is based on taking the maximum accumulated amount of communication successes during the day and dividing it by the maximum expected value, as defined by the system.
As an example, if 96 pollings are made to a remote during one day (every 15 minutes) and the remote successfully answered 90 of them, the uptime percentage will be 93.75% (that is, 90/96). For a given number of remotes in the system, the uptimes are added together, and then they are averaged out.
Indicator Management
After defining how the indicator will be calculated (model taken from electric and IT networks), the challenge became how to enter the information from about 120 remotes the SCADA system received on a daily basis. It started with a manual data load, which required an investment of four man-hours per day. It soon became apparent this was going to be a demanding process in terms of man hours. Therefore, a second key decision was made (the first one was deciding how to measure the data): automatizing the calculation.
Next, specifications were made to develop a computer-based tool that would calculate the indicator easily, at the same time allowing the inclusion of notes, while taking out the calculation of the indicator under controlled conditions. In other words, a software that would allow the management of the indicator.
Figure 3: The date of the calculation includes the name of the concentrator, the remote, successes of the remote and individual uptime.

Figure 4: The recorded behavior of the indicator in the management tool.
After releasing the interface, it was necessary to make some improvements aimed at aligning the calculation of the indicator with the maintenance management that would include:
• A report of the remotes that are below a specified uptime percentage. This supports the prioritization of maintenance activities that must be addressed
• A report showing the remotes that are below a specified uptime percentage with higher frequency. This shows the recurrence of the failures of a remote element
• A log to record controlled intervention situations affecting the calculation value on the indicator
One of the most important contributions of the calculation of the indicator through this tool has been the ability to establish – based on historical information obtained after more than a year of operations and control – that for SCADA systems in Colombia, communication via private networks is more reliable than through public networks, such as the cellular network (average 97.55% vs. 90%.)
Conclusions
• Critical systems, such as SCADA for a natural gas network, can and must be technically controlled in real time, in order to take the necessary measures in the shortest time, making it easier to achieve maximum monitoring uptime.
• The uptime indicator may be implemented on any existing technology with any inquiry interval for remotes. It is desirable to monitor as many points as possible in the SCADA.
• The union between the management and technical proceedings related to SCADA may be considered as measured with a single figure.
• Promigas found it necessary to automatize its management due to the data volume and how expensive it was to process it.
• In the particular case of Colombia, the management system indicator and its result served as the basis for the proposal regarding the management of SCADA systems. The system is being studied by the regulator (CREG) for its implementation, among other measures, as a mandatory compliance measure for the natural gas transportation operators in the country.
Authors: Julio Mercado is an electrical engineer who graduated from the Universidad del Cauca in Popayán, Cauca, Colombia, and has been the SCADA leader at Promigas in Barranquilla, Colombia for 13 years.
Alejandro Villalba is operations manager at Promigas in Barranquilla, Colombia, and has been with Promigas for 20 years in pipeline operations activities and information systems-related projects. He holds degrees in industrial engineering and projects management from Universidad del Norte, in Barranquilla, Colombia.

Comments