April 2018, Vol.245, No.4
Features
Automating Surge Analysis Studies Saves Time, Money
By Garry Hanmer, Product Manager, Atmos International
Operations such as valve movements, pump power failures and pump start-ups can initiate sudden changes in the fluid flow velocity in a pipeline. These sudden changes cause transient pressure surges that can significantly damage a pipeline.
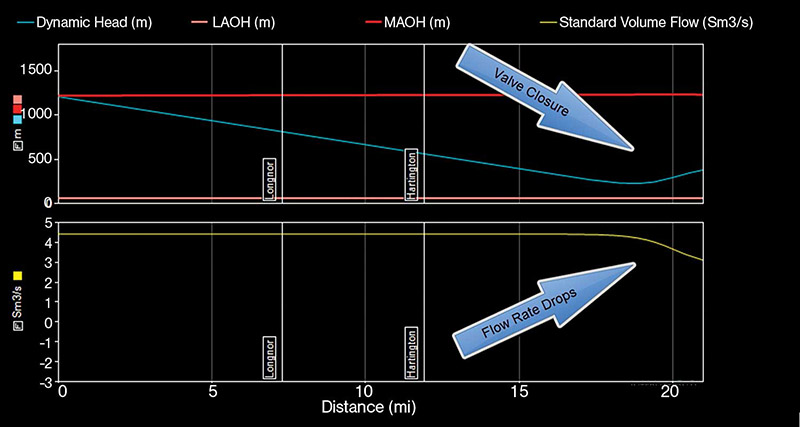
Pressure surge can force the operating pressures above a pipeline’s allowable maximum and minimum pipeline pressures. High pressures can damage pumps, valves, and other pipeline equipment, or even a rupture. Vapor cavity closures can produce high shock pressures. Low pressures can cause pipeline collapse and cavitation. When unmitigated by surge protection, pressure surges can reduce the life expectancy of a pipeline.
Surge analysis studies simulate the behaviors of pressures and flows in fluids caused by transient operations. These studies are an essential part of pipeline design and operations planning. Hydraulic analysis can identify potential pressure surge risks and helps in the design and verification of surge mitigation measures.
Some regulating authorities, for example, the U.S. Department of Transport (DOT), require pipeline operators to maintain and file current surge analysis studies for all their pipelines. Many pipeline operators find this is a demanding, time-consuming task, especially for those who operate many miles of pipelines. Simulation software with surge analysis tools can automate this tedious process.
This automation includes the scheduling of simulation scenarios and the creation of the surge analysis report. Automation allows for the fast, efficient review of entire pipeline networks saving significant time and resources. We see this efficiency whether the surge study is required to confirm the safe condition of pipelines or for compliance with regulatory requirements.
Regulators from around the world expect pipeline operators to perform surge analysis studies on their pipelines. Especially on pipelines that transport hazardous liquids and gas pipelines. For example, U.K. Pipeline safety regulations state:
“The pipeline operator shall ensure that no fluid is conveyed in a pipeline unless the safe operating limits (SOL) of the pipeline have been established and that a pipeline is not operated beyond its SOL.”
Pipeline safety regulations around the world include similar pipeline safety rules, for example:
- DOT’s Pipeline and Hazardous Materials Safety Administration (PHMSA)
- British Standard Code of Practice for Pipelines
- European Harmonized Standard Petroleum and Natural Gas Industries – Pipeline Transportation Systems
The standards sometimes allow short excursions of pressure above maximum allowable operating pressure (MAOP). Some regulations may allow operation of a pipeline for short periods at pressures above MAOP. No rule allows operation of a pipeline above the pipeline’s SOL. The SOL for the maximum pressure is typically 10% to 15% higher than the MAOP limit, depending upon local pipeline safety regulations.
Performing the surge analysis
A surge analysis study can determine where the risks for pressure surges exist. The studies can also test procedures to mitigate those risks. The surge analysis studies simulate operations such as valve closures and pump station shutdowns and analyzes the resulting fluid behaviors. Once the analysis identifies the hydraulics risks such as fatigue damage to the pipeline and equipment, the operator can implement mitigation procedures.
Mitigation procedures include adjusting valve opening and closing times, and the addition of components such pressure relief valves and surge tanks. Other surge mitigation measures include increasing the pipeline diameter, increasing the pipeline wall thickness or adding loops.
Pressure surge scenarios should consider all the potential threats to the pipeline that could cause a pressure surge. As the hydraulic behavior of each pipeline is different, the threats may vary. Typical threat scenarios include:
- power failure in the motors driving the pumps
- closure of the pump delivery valve in a specific number of seconds
- pump trip while another pump continues to run
- restarting a pump within a given number of seconds after the pump trips
- closing a control or emergency shut-down valve rapidly
- opening or closing a specific valve too quickly
- a pipeline component malfunction
- increase in the demand
It is advisable, sometimes required, to perform a surge analysis when there are changes to a pipeline design or operating conditions. The study should consider all the modifications to the pipeline and its operating conditions. It should test the effects of these modifications on all parts of the network. It is not sufficient to just check the modified section of the pipeline. Design data includes characteristics such as flow rates, component operating characteristics, material specifications and fluid properties.
Software Functionality
Hydraulic simulations are an effective way to evaluate the effects of pressure surge on the entire pipeline network, including any branches. Simulation can analyze the pipeline network or various subsections of the network. The following functionalities in a simulation software facilitate faster and more effective hydraulic simulation for surge analysis:
- variable knot spacing allows for faster analysis without loss of accuracy while minimizing interpolation and errors
- variable time steps enhance the accurate analysis of the pressure wave propagation
- reverse velocity modelling for dynamic check valve simulation
- pump modeling to simulate accurate spin–up and spin-down times
- control logic to accurately simulate pipeline control systems during surge events
- valve characteristic inputs for accurate valve closure modeling\
Reduced Time
Detailed pipeline assessments require the computation of numerous calculations for each pipeline Section A surge analysis study requires the analyze of the pipeline pressures for an extensive variety of different operating conditions. Such conditions include each possible valve closure, pump trip, and fluid property change.
Standard pipeline simulation packages provide accurate transient surge predictions and analysis on pipeline sections, but it is normally tedious time-consuming work. A surge analysis tool added to a simulation package saves significant time.
The surge analysis tool automates the entire procedure into a single efficient step. This includes the scheduling of operational scenarios and running those scenarios. The tool tests the data for each scenario against preset “pass” and “failure” criteria.
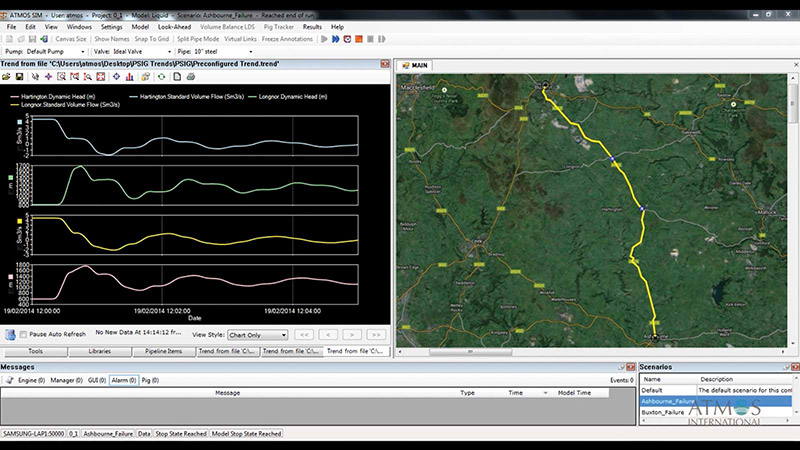
The surge analysis tool automatically analyzes all selected parts of the pipeline sequentially and reports the results of each surge scenario and produces tables and trends of the data. Data reported includes the ensuing pressures and the locations of pipeline maximum pressure points. The tool also outlines the time of every pump trip in a format that regulatory authorities and surge analysis engineers can easily scrutinize.
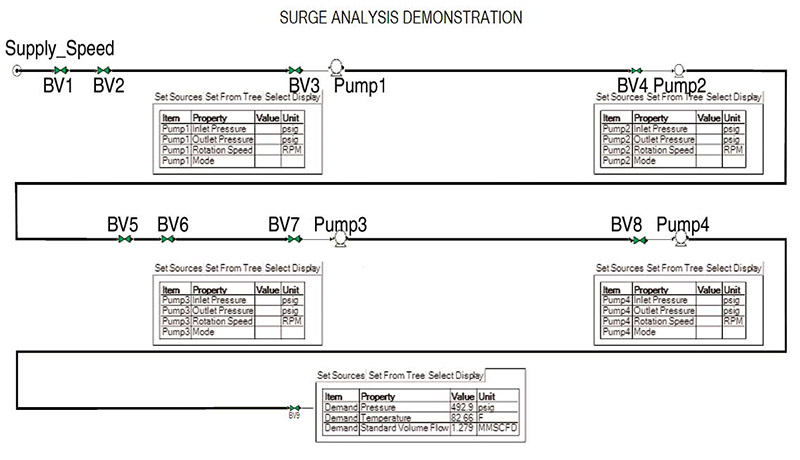
Figure 3 shows a sample pipeline configuration for a pipeline with four intermediate pumping stations.
Data for each pressure surge scenario tabulated in the report includes:
- Software version for traceability
- Project name and description
- Date report
- Name of closed valve\tripped pump
- Indication of MAOP\SOP violation
- Time\location\pressure of MAOP OP violation
- Pump trip times
The report also includes trends for each pressure surge scenario including:
- pressure trend at MAOP\SOP violation
- pressure trend upstream of valve closure\pump trip
- maximum piezometric pressure profile for each scenario
- minimum piezometric pressure profile for each scenario
- scenario flow trends
When a scenario violates the MAOP or SOP, the surge analysis tool automatically generates the pressure trends at the location of the MAOP or SOP. The user does not need to predefine a reporting point at the location of the violation. This eliminates the need to for an initial analysis to determine the location of the violations and a second study to interrogate the pressure trends at the location of the violations. This information can help in the design of a surge mitigation procedure or selection of a surge prevention device to prevent any failure predicted.
Conclusion
A conventional surge analysis study can take several days, weeks, or even months to conduct, depending complexity of the pipeline. The surge analysis tool can conduct the same study in a few hours by automating routine tasks such as running individual pressure surge scenarios, interrogating the simulation results and generating a surge analysis report.
This automation reduces simulation engineering costs and increases pipeline revenue. This additional revenue is generated through faster confirmation of the ability to operate within the pressure boundaries and justifying the operation of higher capacity demand schedules.
The surge analysis tool’s automated interrogation of results reduces the risk of human errors in these critical studies. As the demands to safely increase pipeline capacity continues, the automation of surge analysis studies makes a lot of sense. P&GJ
Author: Garry Hanmer is a product manager at Atmos International in Manchester, U.K., and has more than 12 years’ experience in the pipeline industry with an emphasis on pipeline hydraulic simulation. Hanmer earned a master’s degree in aeronautical engineering from the University of Salford, U.K.


Comments