
February 2018, Vol. 245, No. 2
Features
Measurement Technologies Look to Improve Methane Emissions
By Daphne D’Zurko, Executive Director, and Joe Mallia, Senior Project Manager, NYSEARCH, Parsippany, N.J.
In 2014, increased attention to greenhouse gas emissions by the environmental community and the public at large started to focus on methane emissions in proximity to the gas infrastructure.
With technologies that generally took indirect atmospheric methane concentration measurements, various environmental groups and universities took interest in how to aid gas companies to prioritize repair of ‘non-hazardous’ leaks.
Local gas distribution companies (LDCs) have a long history in meeting regulations while refining the most practical procedures for leak survey, detection, classification and localization. Despite safety being the natural gas industry’s top priority, when incidents do happen, the consequences and the reaction to those consequences can further drive improvements in safety.
This attention to gas safety in the LDC sector includes the need for gas-sponsored research and development (R&D) organizations to focus on technologies that can be designed, developed, tested, demonstrated and commercialized. NYSEARCH, a voluntary R&D organization has been focused on gas operations technologies that improve safety, reliability, efficiency and customer service.
In the 2014 timeframe, a new approach toward methane detection was presented to some NYSEARCH members by those in the environmental community. This new approach, termed “mobile methane mapping,” measures methane in the atmosphere at the vehicle location that is sensitive to parts per billion.
However, discrimination of pipeline leaks with these technologies from other sources of methane emissions requires LDCs to further investigate the area to confirm the presence of natural gas from the pipelines and elevated sub-surface methane indications with instruments that are sensitive to parts per million. This step is required to determine that the elevated methane levels in the atmosphere are from buried natural gas distribution infrastructure before classifying the emission source as a “leak indication.”
LDCs classify sub-surface leak indications from a safety perspective using additional factors such as proximity to buildings, sub-surface structures, and extent of paving. Potentially hazardous (Type 1 and 2) leaks are scheduled for repair while non-hazardous leak indications are given a lower priority and can be monitored rather than scheduled for repair.
The LDCs also saw the need to measure the flow rate of non-hazardous leak indications to understand their contribution to methane emission inventories and to prioritize their repair. This required a new look at technologies, both old and new, including new “mobile leak quantification” systems that are evolving from mobile mapping systems.
Initially, a broad assessment was performed based on research of literature and direct interviews with technology researchers at universities and other organizations.
With input from member companies of the voluntary NYSEARCH organization and the Environmental Defense Fund (EDF), a request for proposal (RFP) was established to solicit and later select technology providers. In addition, once the NYSEARCH project management team, the funding members and collaborators agreed on the selection of technology providers, a formalized test plan was prepared.
This test plan incorporated practical experience of the gas LDCs, previous research project test experience for leak detectors and a perspective on how best to apply different technologies to a set of conditions that represent a pressurized natural gas network.
Objectives
The objectives of this program are to identify and evaluate what safe and cost-effective technology or technologies are available, that can be applied from a mobile platform to quantify methane emissions rates of known non-hazardous leaks from the gas distribution pipeline infrastructure.
In the first phase, we conducted a literature search and technology assessment to aid in the evaluation planning and implementation. In the second phase, we formally initiated an evaluation program and tested technologies in a controlled setting. In the third phase, NYSEARCH and its members evaluated the results of the same technologies through live field testing. There is also an active fourth phase, that is co-funded by the Pipeline Hazardous Materials Safety Administration (PHMSA), to define a process for LDCs to independently validate methane emissions measurements from third parties for use as part of the LDC methane identification and leak survey practices.
Technology Providers
In the summer of 2014, NYSEARCH staff researched methane emissions measurement technology and technology providers. Following that assessment, several NYSEARCH funding members saw value in joining a collaborative effort to structure and fund a formal technology testing and evaluation program.
With the participation from the NYSEARCH funding members, a RFP was developed that laid out the specifics of what would be a first step in testing third parties’ technologies. Subsequently, the funding team used a scoring scheme to select three technology providers from the proposals received.
In general, all three technologies were based on measuring the absorption of laser light by methane molecules in air. Two of the technologies, cavity ring-down differential spectroscopy (CRDS), and wavelength modulation spectroscopy (WMS), used a defined air path within the instrument to determine a local concentration while the other measured the absorption on a variable air path to determine an overall absorption of laser light by methane molecules in air.
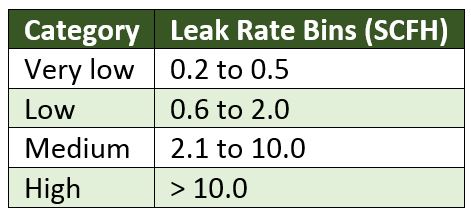
Each technology provider was developing proprietary algorithms for coupling the analyzer data with environmental data and from that deriving emissions estimates at absolute levels or in relative categories of very small, small, medium or large flow rates in terms of units of standard cubic feet per hour (scfh).
Test Methodology
Each technology provider was given the project test plan that was designed to ensure that a formalized, structured and consistent process was undertaken for each series of tests. Then, each Technology Provider was invited for a week at the first controlled test site owned by Public Service Electric & Gas (PSE&G).
The test plan included various protocols to meet the controlled test goals. Some of the test plan specifics included the following:
A mass flow controller was used to impart the controlled releases that were accurate to within +/- 0.8% of the total SCFH measurement.
The wind speed, direction and temperature were monitored and recorded by an independent stationary anemometer at the controlled test site. Appendix A illustrates scenes from the 1st round of controlled testing.
The testing was progressive in the controlled gas releases. The technology provider was given a ‘benchmark’ metered test plume and location to become familiar with the test environment and perform pre-checks and calibration of equipment. Testing continued with scenarios of varied conditions. The metered test plume amount was provided to the technology provider during the initial part of the testing, however metered amounts were not provided during the main tests because the goal was to gain measurements of ‘blind’ metered test plumes.
The test plan called for specific reporting of preliminary data so providers were aware of the expectations and post-processed data. NYSEARCH asked that raw data to be supplied either at the end of the test day or test week and that the processed data be returned within one month of the completed tests.
Second Round
A decision was made in Fall 2015 to delay a selection or decision on the best available technology and to delay a move to the more complicated live field setting. Rather, a second set of controlled tests, with a very similar test plan, was planned to be conducted at Southern California Gas Company’s (a Sempra company) facility in East Los Angeles in February/March of 2016.
One of the goals of the second round of controlled testing was to collect significantly more data when separating the tested flow rates into bins of very low, low, medium and high flow rates. All three technology providers that were used in the first round were asked to repeat the tests. These tests were intended to incorporate any improvements that the technology providers made since the first set of controlled tests. Like the first round, the data was then analyzed by an independent statistician.
Field Tests
Field tests were conducted about eight months after the second set of controlled tests. By reviewing existing records and work plans, one of the program funders, Con Edison of New York (CECONY) identified new leaks that were recently pending as Class 3/Non-Hazardous Leaks.
CECONY then provided from that dataset an inventory of previously-identified leaks in suburban Westchester, NY area for the live field tests. These tests were performed to collect data in the real environment and to evaluate the practicality of applying the methodologies and equipment used by the same technology providers in live conditions from a mobile platform. They also added to the statistical database that was already created through the two rounds of controlled testing.
Surface expression measurement was added during the field testing work to have an independent, direct and more stationary measurement or validation of the leak rates at the time of the Technology Provider’s measurements. The Surface Expression Measurement process used a flux chamber (tarp) laid over the suspected area or pattern of emerging gas. Then, a vacuum draws in the tarped air/gas mixture at a known total flowrate.
A methane detector is placed in the flow to measure methane concentration in parts per million (ppm). Based on the methane concentration and total flowrate, a calculation approximates the methane emission flow rate. The emissions measured by this surface expression measurement served as the basis to evaluate the field measurements by the technology providers. The Technology Provider was also able to compare its initial test measurement to the calibrated emission released at the beginning and end of each day.
An independent statistician reviewed all the test data and performed statistical tests on metrics that were selected after discussions on the decision by the NYSEARCH funders. Those metrics were error or ‘bias’ (using raw data, averaged data and weighted/relative data) and ‘precision’ (or standard deviation on average bias).
The decision to use these metrics was based for the most part on the need to understand each specific indication of methane emissions and the local conditions that surround that indication at the time of the measurement. While alternative metrics were discussed, the consensus was that ranking the highest emitters (the group of leaks that contributed to the top 25% of emissions) from different time periods or different conditions was not considered a way to get at the true magnitude of the methane measurement from the gas infrastructure.
Results
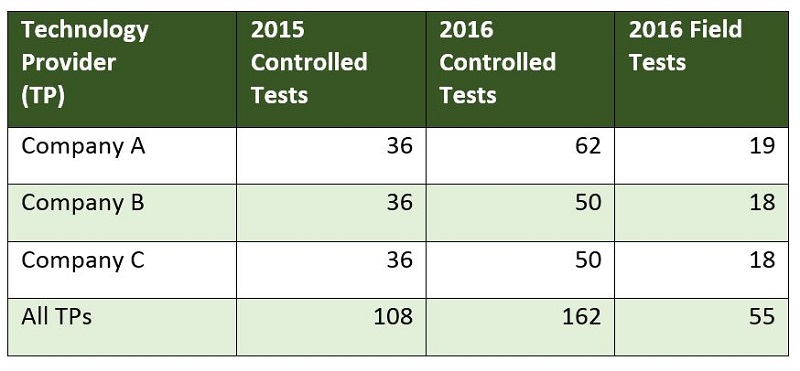
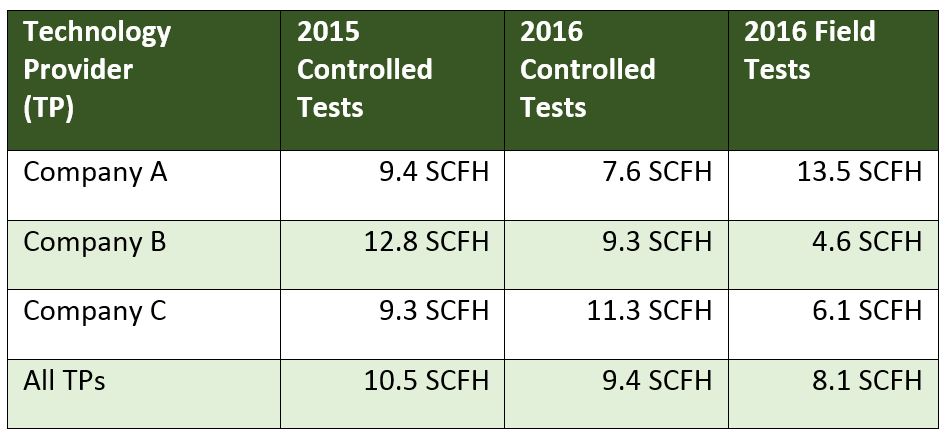
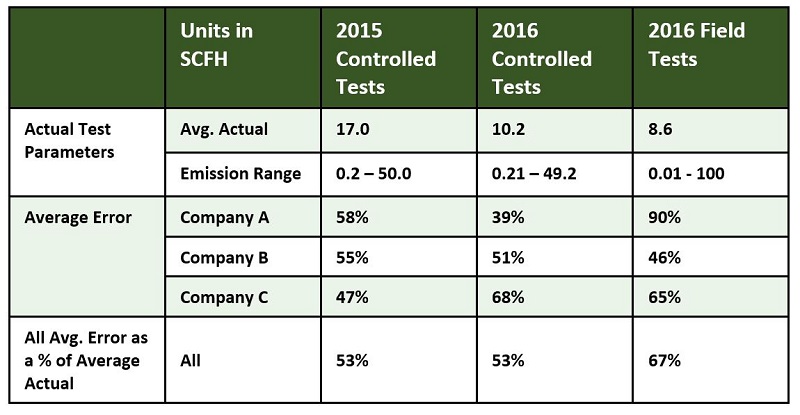
It is noted that there were important differences between the three sets of tests (first-controlled, second-controlled and field tests) because of location and weather or other physical impacts at the sites tested. Tables 1-3 and Figures 1, 2 provide a summary of the breadth of the tests and the results.
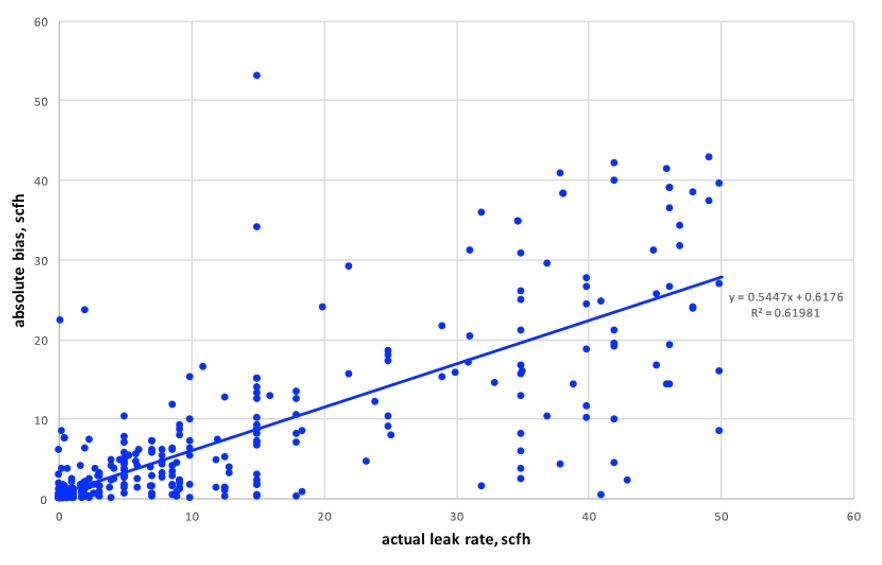
The independent statistical analysis concluded that a linear regression analysis of all test data shows that absolute error is very strongly correlated to actual emission rate. (Figure 3). Thus, there was the need to consider the relative absolute error weighted by magnitude of the emission measurement (Figure 4).
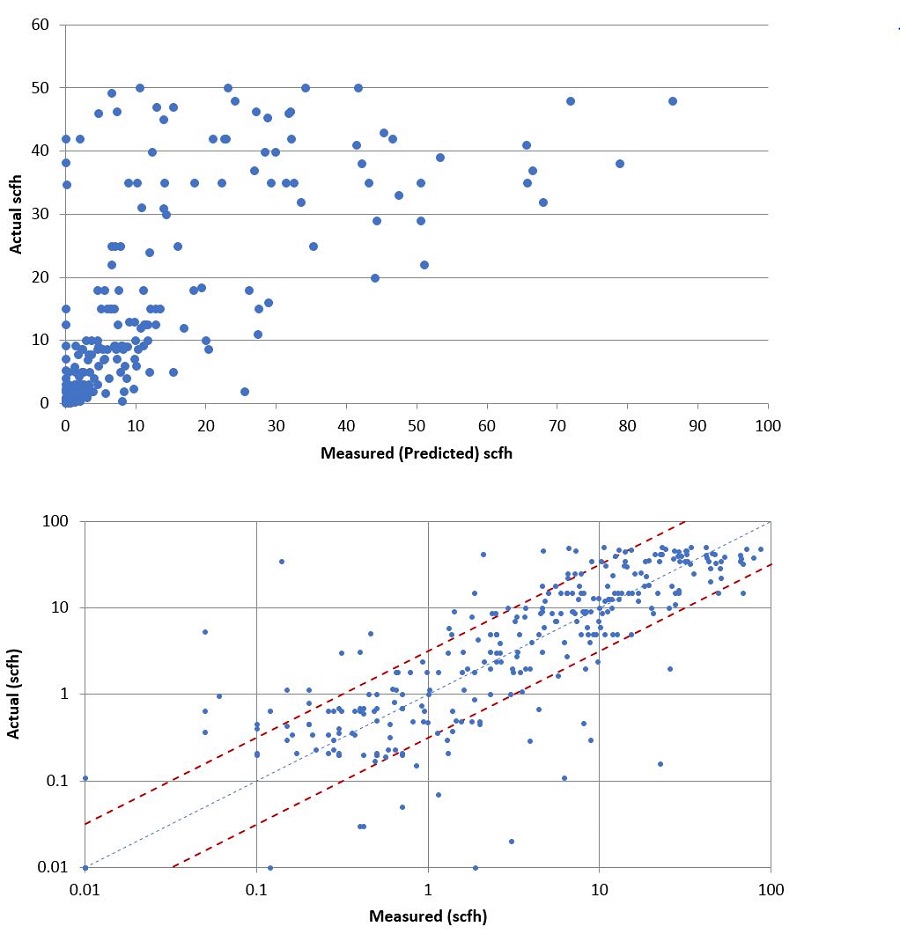
Also shown in are illustrations of the data where actual leak flow measurements (scfh) are graphed as a function of predicted flow measurements from the TPs. Two charts are shown to provide the direct comparison as well as the logarithmic comparison.
Because of the wide variability in the data, the logarithmic scale shows a more direct correlation. It is noted that for the (298) data points that are graphed, there is 77% accuracy shown to within one order of magnitude (see highlights in log chart and data within the red dashed lines).
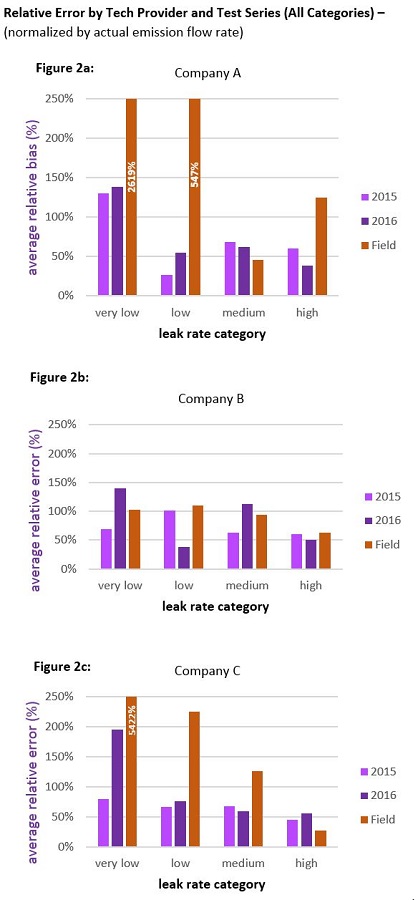
When the measured emissions rates were put into flowrate categories (broken out differently than those shown in Table 1), different errors rates or accuracy numbers emerged.
Overall, during the controlled tests in 2016, using the categories in Table 1 (shown in previous Methodology section), the TPs correctly categorized the emissions 59% of the time. When altering the breakpoint for a bin or category to best fit results, it was found that emission sizing success rate typically improved.
Given our intent to keep each test segment as similar as possible, the NYSEARCH project manager recorded the weather conditions and included an independent anemometer to log wind rate and direction throughout the tests. There were consistent weather conditions for each of the technology providers during the controlled tests in that each had similar conditions to test in their given week even though the weather varied within their week.
During the controlled tests, there were preferred wind conditions and rates for some of the CRDS measurements. The preferred range for wind was 2-8 mph. During the field testing, rainy conditions and increase in ground moisture resulted in a decrease in methane emissions from CECONY’s system and lower emissions from sewers and storm drains than prior to the rain. Thus, pipeline emissions or leaks were dependent on time and ground condition.
Validation Process
NYSEARCH’s funders have been working on the concepts and methods for validation since 2016. Based on these multi-company discussions, we decided to develop a formal guideline that incorporates a framework for validating independent third-party emissions quantification technologies while allowing flexibility for a broad range of applications and conditions, policies, and weather patterns such as wind and turbulence.
A flexible validation protocol that is tested and determined to reflect a standardized approach will allow gas companies to conduct “boots-on-the-ground” investigations and verify the system-specific methane emission. Once validated, such leaks can be properly prioritized for mitigation/repair.
The funding group is working with an independent consultant to draft the methane emission quantification guideline using the API1163 standard that has been a successful framework for implementation of in line inspection (ILI) tools in the gas industry. Following completion of a draft guideline, a test plan for validation by gas operators is being developed and a new set of tests are being arranged and completed to focus on the accuracy, practicality and value of the proposed validation process.
Ongoing Steps
As we continue the analysis of the field test and controlled test data, there is discussion about how this extensive emissions rate dataset and other test data can be used to build a model to understand the true methane emission flow rate and how that is impacted by different soil conditions and other external influences. We realize that developing a model would over-simplify real conditions and would therefore need careful consideration of its use.
Conclusion
Improvements in estimates of gas LDC system emissions have been made in the last few years. Yet, the NYSEARCH members believe that more work is required to implement technologies into gas company operations. By fully understanding the application of emissions measurement technologies to the LDC infrastructure, we can better support policymakers in work that combines a focus on safety with overall reduction in methane emissions. P&GJ
Acknowledgements: We would like to acknowledge the contributions from NYSEARCH member sponsors of this project: Central Hudson Gas & Electric, Consolidated Edison of New York, National Grid (for companies formerly known as Keyspan and Niagara Mohawk Power Corporation), National Fuel Gas, New York State Electric & Gas, Orange and Rockland Utilities, Rochester Gas & Electric, Pacific Gas & Electric, PECO Energy, Public Service Electric & Gas, Southern California Gas, SouthWest Gas, Xcel Energy, and Union Gas.)
Authors:

Daphne D’Zurko, Executive Director, NYSEARCH, Parsippany, N.J.

Joe Mallia, Senior Project Manager, NYSEARCH, Parsippany, N.J.

Comments