
June 2022, Vol. 249, No. 6
Features
Emerging Trends, Approaches in Engineering Assessments Pipeline Safety
By Benjamin Mittelstadt, P.E., and Dan Williams, P. Eng., Dynamic Risk
The increased application of robust engineering assessments/fitness-for-service evaluations is expected to play out in several key ways.
Increasing pipeline safety and reliability performance. This really boils down to achieving the next level of safety through focused engineering work and the development and application of technology to enhance data gathering and integration, assessment techniques and associated workflows.
Addressing the new and emerging regulatory landscape designed to help achieve improved safety and reliability performance – Without the insight and analyses from engineering assessments (EA), compliance may result in pipe replacement, pressure reductions, pressure testing and other material actions on pipe that is otherwise fit-for-service.
Providing an effective performance-based pathway forward – EAs provide detailed engineering and fitness-for-service evaluations to obtain the greatest yield from resources in terms of increasing pipeline safety and reliability and providing the biggest return on investment.
This article focuses on the following key topic areas because it pertains to EAs and engineering critical assessments (ECA): driving factors and trending, code-related considerations, data integration, framework strategies and application.
It is important to start out by reviewing definitions related to EAs and ECAs. There are also some interesting differences in how these are considered in the Canadian Standard versus the U.S. Code.
Both EA and ECA are defined in the Canadian Standards Association (CSA) Z662. CSA Z662 distinguishes between EAs and ECAs.
Engineering Assessment: An EA is a documented assessment of the effect of relevant variables upon fitness-for-service or integrity of a pipeline system, using engineering principles conducted by or under the direct supervision of a person experienced in the application of engineering and risk management principles related to the issues being assessed.
In the Canadian Standard, an EA applies to demonstrating fitness-for-service in a variety of circumstances.
Engineering Critical Assessment: An ECA is an analytical procedure that is based on fracture mechanics principles that allows determination of the maximum tolerable sizes for imperfections in fusion welds.
In the Canadian Standard, an ECA applies specifically to the consideration of imperfections in girth welds after construction. Guidance on the application of an ECA to girth welds is provided in Annex J of the Standard.
The U.S. Codes do not specifically define the term critical engineering assessment; however, ECA is defined in 49 CFR Part 192.31 (referenced in Subpart L Sections 192.624 and 192.632) as part of the Gas Mega Rule and new maximum allowable operating pressure (MAOP) reconfirmation requirements.
Engineering Critical Assessment: An ECA is a documented analytical procedure that is based on fracture mechanics principles, relevant material properties (mechanical and fracture resistance properties), operating history, operational environment, in-service degradation, possible failure mechanisms, initial and final defect sizes and usage of future operating and maintenance procedures to determine the maximum tolerable sizes for imperfections based on the pipeline segment MAOP.
In the U.S. Code, an ECA is not specific to flaws in girth welds and has a broader fitness-for-service intent across various threat and defect types that overlaps with that of EAs in the Canadian Standard.
Whether we are talking about the Canadian Standard EA or the U.S. Code ECA, these are both detailed fitness-for-service assessments that consider various threats and defect types.
Circumstances for and the use of EAs (Canada) and ECAs (U.S.) are converging in Canada and the U.S., including, but not limited to, the following:
- Class location designation change
- Licensed/approved maximum operating pressure (MOP) or MAOP upgrade
- Defect assessment or evaluation of damage
- Flow reversal or change in service
- Reactivating or repurposing a pipeline
- Pressure testing an existing pipeline
- Valve location and spacing
- MAOP validation and reconfirmation (U.S.)
- Special permits (U.S.)
- Governance (safety and reliability case management)
- Return to service after failure or outage
Class location designation changes are expected to continue to be a key driver for EAs and ECAs in Canada and the U.S., respectively. The industry is spending hundreds of millions of dollars every year on pipe replacements where the existing pipe does not align with design requirements for the new class location designation.
CSA Z662 Clause 10.7.2 requires a conformance check to five key elements (mainly design related) for pipe in a class location designation change area. This includes the design factor or location factor, valve spacing, depth of cover, pressure testing and evaluation and repair of imperfections.
While there is provision for EAs to be carried out if one or more of the five elements cannot be met, it is acknowledged that deviations from design-based elements can create a challenge for gaining stakeholder approval and can result in replacement or pressure reduction actions that are not necessarily performance-based or measurably improve pipeline reliability and safety.
Similarly, in the U.S., current approaches to evaluate a pipeline’s fitness-for-service in class location designation change circumstances are arduous because of the special permitting process (or potentially in the future through the current Notice of Proposed Rule Making [NPRM] related to class location change requirements).
Reconfirmation of MAOP has the potential for creating billions of dollars of effort if the industry must rely on replacements, pressure reductions and pressure tests for compliance. EA methodology or other technology solutions can provide an alternative pathway forward when there is sound technical evidence that the pipe is otherwise fit-for-service.
There are some cases when pipe replacement is required, but the EA should support this.
Driving Factors
There is a universal mandate from corporate governance structures, new and emerging regulations and the public to increase pipeline safety and reliability performance. Success of these efforts is critical to maintain the industry’s social license to operate.
The industry has made great strides in improving pipeline safety and reliability performance through compliance with integrity management, operational and maintenance regulations and initiatives to move beyond compliance only.
Although the industry, regulatory community and the public have been diligently working to determine how best to increase pipeline safety performance, all stakeholders acknowledge that the next level of performance will not be easy to accomplish from technical, operational and commercial perspectives.
Without the insight and analyses from EAs in application with improved technology for enhanced data gathering and integration and assessment, compliance may result in pipe replacement, pressure reductions, pressure testing and other material actions on pipe that is otherwise fit-for-service. These massive resources allocations can be otherwise directed more effectively toward mitigating priority safety and reliability risks.
The U.S. regulatory structure continues to go through significant changes that will facilitate gaining the next level of pipeline safety and reliability performance. Part 1 of the Gas Mega Rule contains changes to the regulations for gas transmission pipelines and new requirements for the verification of pipeline materials.
This part of the rule aims to improve safety with transportation and operation of onshore gas transmission pipelines. Operators will be required to reconfirm the MAOP of their pipelines to ensure their safety, including pipelines that had been exempted from previous safety rulings.
Part 2 of the Gas Mega Rule contains new repair requirements for high-consequence areas (HCAs) and non-HCAs. Similar rulemakings have been made or are underway in the U.S. for liquids pipelines, gathering pipelines and gas storage facilities.
Figure 1, presented as a forward-looking case study, outlines an anticipated generational transformation driven by the Gas Mega Rule and NPRM activities. The phase diagram shows the approximately 300,000 miles (480,000 km) of U.S. gas transmission pipelines. Looking at the y-axis, integrity management has largely been focused on about 20,000 miles (30,000 km) of pipelines in HCAs, with that focus based on inspection-based maintenance as illustrated moving along the x-axis.
The other 280,000 miles (450,000 km) have been managed via design, construction, and operating and maintenance (O&M) considerations, recognizing that many operators have moved beyond this. Going forward, the HCA miles will begin the journey in transforming from inspection-based maintenance to performance-based integrity management.
Pipelines in Class Location Designations 3 or 4, moderate-consequence areas (MCAs) and likely most of the remainder of the pipelines will enter inspection-based maintenance and advanced fitness-for-service approaches.
Although it has some limitations, the Gas Mega Rule has provided a strategic framework for improving pipeline safety and the use of EAs, represented by the center portion of the phase diagram.
The increased application of robust engineering assessments/fitness-for-service evaluations is expected to play out in several key ways.
Detailed engineering and fitness-for-service evaluations will provide the best pathway forward to obtain the greatest yield from resources in terms of increasing pipeline safety and reliability and providing the largest return on investment.

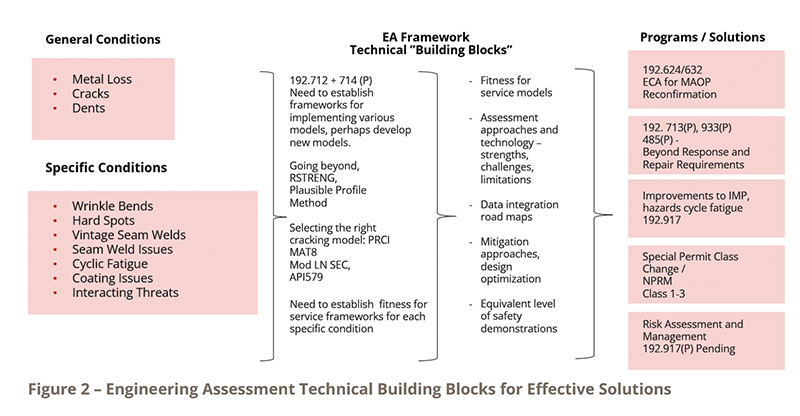
As outlined (Figure 2), consistent, repeatable approaches (technical building blocks and programs) that can easily integrate and aggregate into solutions for more complex compliance and technical circumstances will serve to best support this pathway.
On the left of the figure are some primary and specific conditions and threats that need to be addressed. In the middle of the figure is where the technical building blocks are improved or developed.
The far right of the figure shows the programs that will be constituted by a logical and pertinent arrangement of the technical building blocks to best achieve compliance and, most importantly, improve safety and reliability performance. These programs comprise consistent and repeatable workflows.
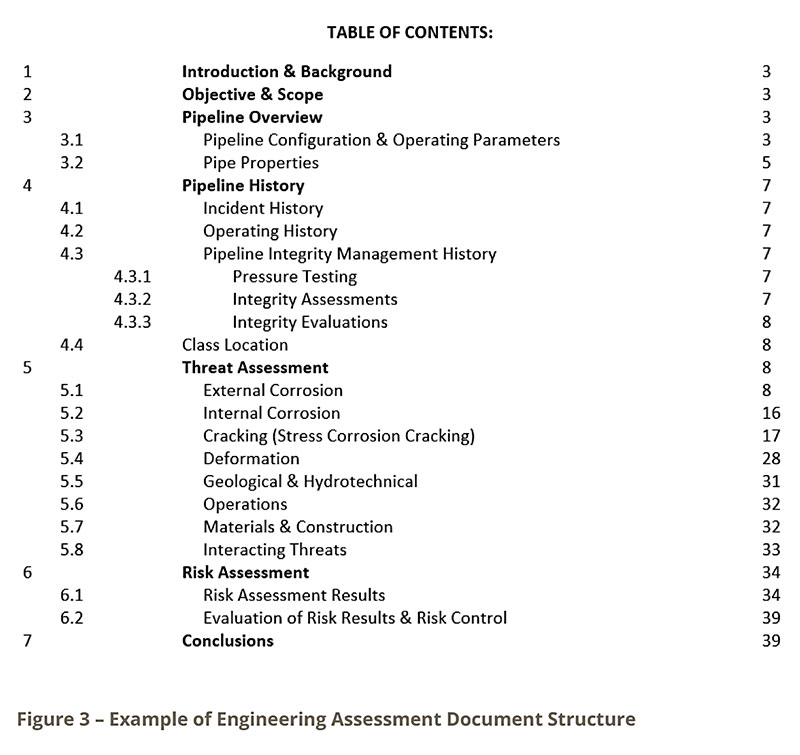
Supporting the technical building blocks and pathway toward effectively demonstrating safe and reliable pipeline operations is a well-structured EA approach and document design that provides stakeholders with a logical flow of technical analysis in support of the EA conclusions, as outlined in the basic example in Figure 3.
Code Considerations
Clauses 3.4 and 10.1 of CSA Z662 provide the requirements for EAs. Clause 3.4 establishes the structural requirements for the EA while Clause 10.1 provides the detailed elements that need consideration as applicable.
There is an opportunity to focus the EA as applicable to a specific threat or circumstance, but there is also a requirement to consider risk assessment as part of the analysis.
With respect to the U.S. Code and Gas Mega Rule requirements, 49 CFR Part 192.632 (Engineering Critical Assessment for Maximum Allowable Operating Pressure Reconfirmation: Onshore Steel Transmission Pipelines) requires that when operators conduct an MAOP reconfirmation in accordance with 49 CFR Part 192.624(c)(3) “Method 3” using an ECA to establish the material strength and MAOP of the pipeline segment, the ECA must assess:
“Threats; loadings and operational circumstances relevant to those threats, including along the pipeline right-of way; outcomes of the threat assessment; relevant mechanical and fracture properties; in-service degradation or failure processes; and initial and final defect size relevance. The ECA must quantify the interacting effects of threats on any defect in the pipeline.”
Of particular interest, as it pertains to a potential pathway forward for demonstrating margins of safety for existing pipelines versus pipeline replacement, the CSA Z662 Risk Management Task Force has developed proposed, quantitative Safety Risk and Environmental Risk acceptance guidelines for the 2023 Standard (not yet approved) as part of the non-mandatory Risk Management Annex (Annex B) in CSA Z662.2
These risk acceptance thresholds are expected to be a useful tool in demonstrating pipeline safety to stakeholders in the context of both pipeline risk assessments and EAs. Proposed risk acceptance criteria are as follows:
Guidance on safety risk (LoF3 x CoF4) acceptance criteria:
- Individual risk:5 Broadly acceptable individual risk threshold is 1 x 10⁻⁶ per year, and the maximum tolerable risk threshold is 1 x 10⁻⁴ per year.
- Societal risk:6 Broadly acceptable and maximum tolerable thresholds are as established on an F-N curve7 (Figure 4).
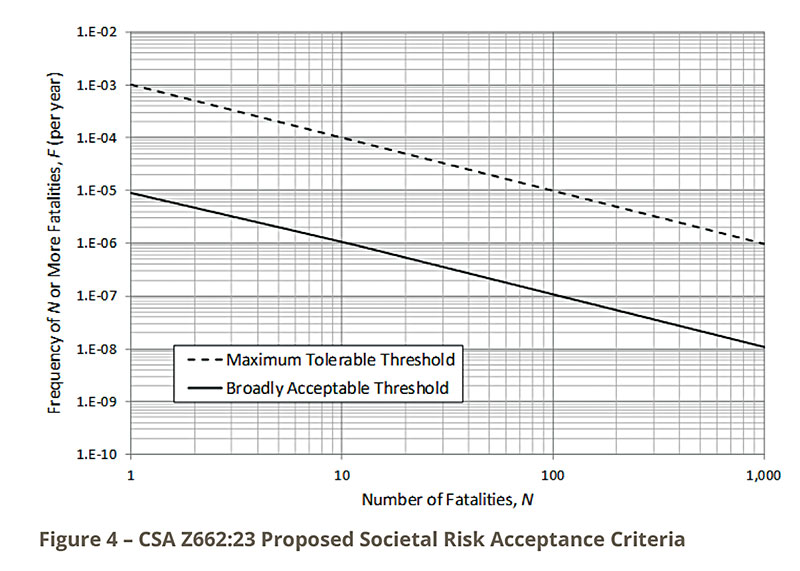 Figure 4: CSA Z662:23 as a proposed societal risk acceptance criterion
 - Guidance on environmental risk acceptance criteria of broadly acceptable environmental risk threshold is 2.4 x 10⁻² m3/km-year and the maximum tolerable risk threshold is 2.4 m3/km-year (impact-adjusted release volume).8

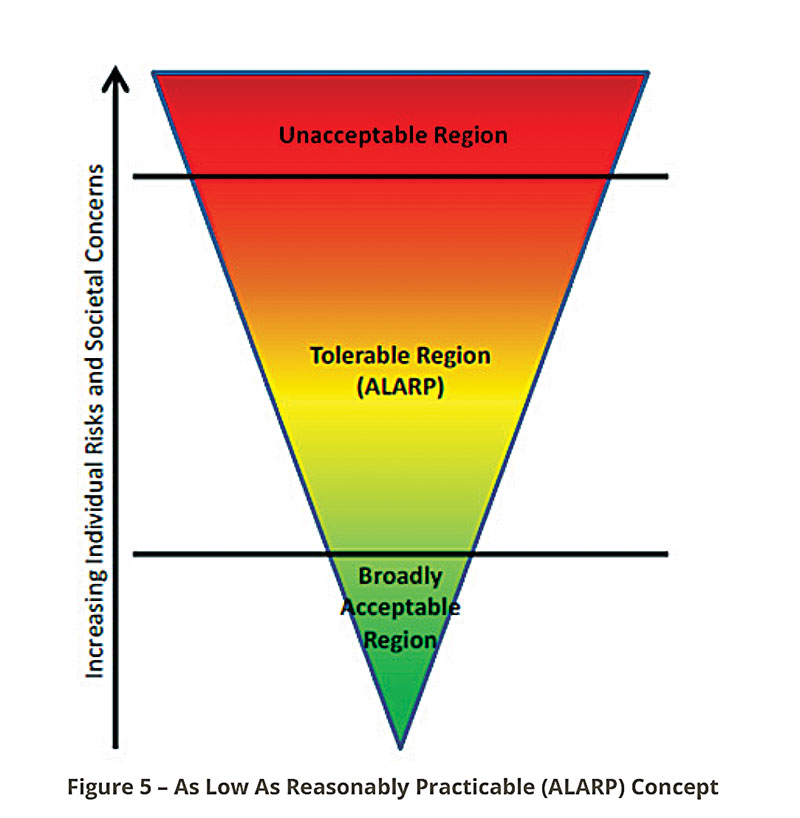
With respect to broadly acceptable and maximum tolerable risk thresholds noted in the above criteria, the region between these two thresholds is considered tolerable risk if it can be demonstrated to be as low as reasonably practicable (ALARP), as shown in Figure 5. The triangle represents the decreasing risk and the diminishing proportional benefit as risk is reduced.
By definition, demonstration of ALARP requires that the cost of further risk reduction is grossly disproportionate to the risk reduction achieved. So, with respect to risk acceptance thresholds, if one can demonstrate that the risk levels satisfy broadly acceptable or ALARP requirements, a compelling case for pipeline safety can potentially be made in the context of a pipeline EA.
Application of risk acceptance criteria, such as those proposed for CSA Z662:23, provide a strategic framework for improving pipeline safety and the use of risk assessment within an EA.
Quantitative risk acceptance criteria are also of interest to the U.S. regulatory bodies and have been explored through recent Pipeline Hazardous Materials and Safety Administration (PHMSA) industry studies and work groups related to quantitative risk modeling and risk tolerance thresholds. Independent risk and reliability-based safety cases are increasingly being requested as an important element of EAs by U.S. regulatory bodies.
Data Integration
Accurate data underlie the successful implementation of EAs. This includes all pipe material attributes, construction, inspection and operating data necessary for the EA/fitness-for-service frameworks for all relevant threats and conditions.
Creation of data integration road maps for each technical building block and the aggregation of these on a pipeline system basis yields a vision of the required data flows to support an effective EA. This vision includes being able to extrapolate learnings across sampling populations and across pipeline systems and hopefully across the industry in data warehousing approaches. Data integration requirements would be documented in standard operating procedures (SOPs) and fully integrated into an operator’s business management infrastructure, such as a geographical information system (GIS), warehouse management system (WMS, as it applies to pipeline data), and data management software (DMS).
The current focus on and requirements for materials verification and traceable, verifiable and complete (TVC) records aligns with these data needs. Minimizing the use of default values ensures that a risk-prioritized focus is not distorted.
Integrity data collected from continuously evolving and improving inline inspection (ILI) technologies will increasingly act as a key foundation for EAs, including ILI tools for metal loss, cracking, mechanical damage and specific conditions (i.e., hard spots, long seam flaws, pipe movement).
It is, therefore, important that the objectives be clearly defined, and that the correct ILI technology be applied for assessing the applicable threats. This includes consideration of the detection and sizing capabilities.
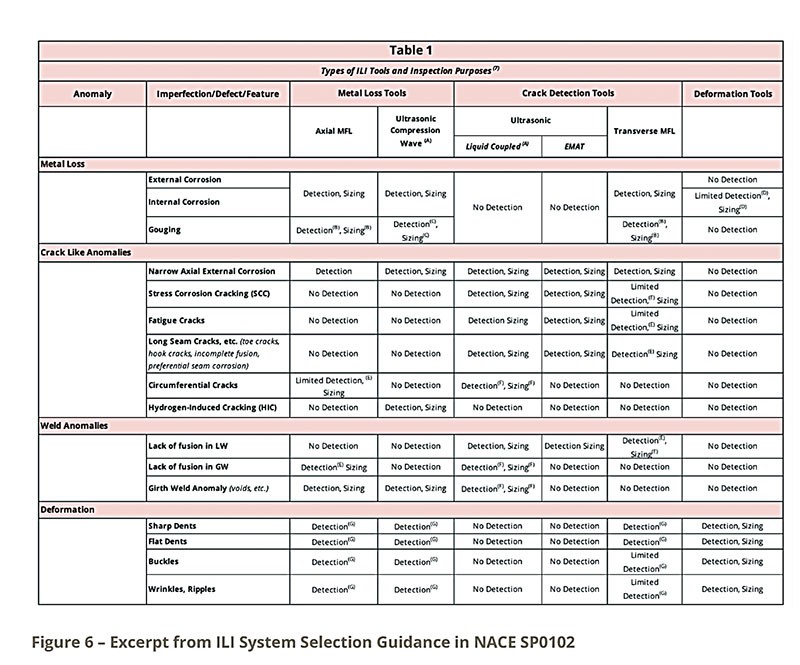
As an example, the newer generation electromagnetic acoustic transducer (EMAT) ILI technology has evolved significantly to a point where it can play a primary role in stress corrosion cracking (SCC) assessment and management programs for gas transmission pipelines. The NACE SP0102 Standard9 (referenced in the API 1163 Standard)10 provides guidance on proper tool selection by threat (Figure 6).
A documented verification and validation assessment of the ILI tool performance is a necessary foundation for using the ILI data as part of the EAs. Also, the qualification programs related to non-destructive evaluation (NDE) tools used in the field for such validation also play a key role in ensuring that the ILI results are accurately validated.
Where ILI data serve as a foundation for the EA, it should not be taken for granted that all stakeholders are familiar with or accept applied ILI technology (particularly for less-established technologies).
A full API 1163-based analysis, including the tool selection against the objective, the run verification (i.e., data quality assessment, run functionality checks) and tool performance validation (i.e., unity plots of tool vs. in-field measurements) should be included.
There should also be workflows and analysis steps to deal with outliers in tool performance. There needs to be pathways for investigation and root cause analysis for outliers and, where necessary, opportunities to reject the inspection where outliers or significant data degradation gaps cannot be resolved.
Framework Strategies
Proven strategies have been developed and applied for completing effective EAs through the following three-step process:
Step 1 – Engineering Assessment Process and Personnel
- Define the level of effort (scope) based on the integrity issue or circumstance being addressed.
- Set up the engineering assessment (EA) team based on competencies, the threat/circumstance being considered and resource capacity.
- Set up an EA review team, process and schedule. This ensures that appropriate oversight and critical review is in place (this can include senior technical review, executive review, internal regulatory review and legal review, as applicable).
- Define ownership and responsibilities. It is important to have an overall Technical Lead who can be responsible for the compiled assessments and content and provide necessary direction to the work streams. An overall project manager may also be needed if there are multiple assessments, steps, sub-processes or data sources.
Step 2 – EA Structure and Alignment with Stakeholders
- Develop a table of contents (TOC) and outline (Figure 3).
- Use appendices for static, repetitive content (i.e., multiple EAs or line segments) or supporting content to provide greater clarity and easy review. Examples of appendix content include program information, assessment methodology details, competency lists and inline inspection (ILI) tool validation analyses support.
- Determine if the EA will be focused on specific threats or if it will be a full fitness-for-service review of all threats. Apply threat-specific approaches where applicable.
- Consider data sources, accuracy and integration strategies.
- Incorporate EA process quality control (QC) and checklists to document the data used and verification steps conducted.
- Use the draft TOC to communicate and navigate with stakeholders (internal and regulatory) for agreement on TOC/structure/content before the draft EA report is completed.
Step 3 – Detailed Engineering Assessment Content and Approaches
- Demonstrate fitness-for-service and margins of safety using visualization (plots, graphs). Threat by threat review may include remaining feature profiles and critical flaw curves.
- Demonstrate criticality of remaining flaws vs. maximum allowable operating pressure (MAOP)-based safety levels.
- Support ILI validation. When ILI data serve as a key input to the assessment, ensure that a supporting ILI tool performance verification and validation analysis is included along with outlier analysis (as applicable).
- Demonstrate how ongoing fitness-for-service can be maintained before flaws reach critical size. Consider the use of both reliability (probabilistic) analysis and deterministic analysis.
- Consider incorporating risk results (as applicable).
Application
This section includes some examples of specific EA content and analyses as it pertains to corrosion and crack flaws and risk and reliability. In these examples the goal is to demonstrate the incorporation of effective visualization into the EA to demonstrate margins of safety.
In the EA example for corrosion analysis (Figure 7), the remaining (unrepaired) metal loss features detected from the most recent magnetic flux leakage (MFL) ILI are assessed against response classifications such as failure pressure ratio (FPR)11 ≤ 1.1 or depth ≥ 80% of nominal wall thickness, for example.
The feature severities and margins of safety along the pipeline segment are made apparent through the metal loss profile as plotted against response thresholds.
Application of growth analysis to features since time of inspection allows for an assessment of remaining margins of safety with respect to these response classifications at both the current time and up to the future time of the next planned reinspection as features grow toward these thresholds.
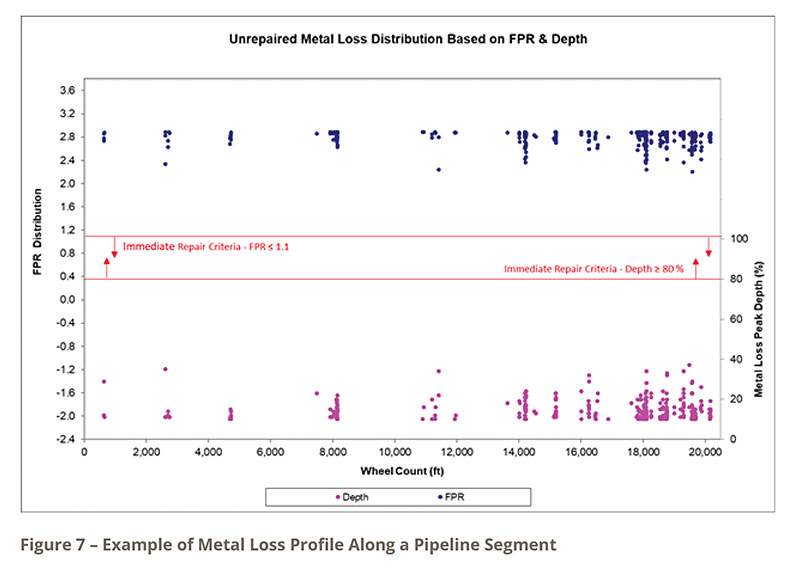
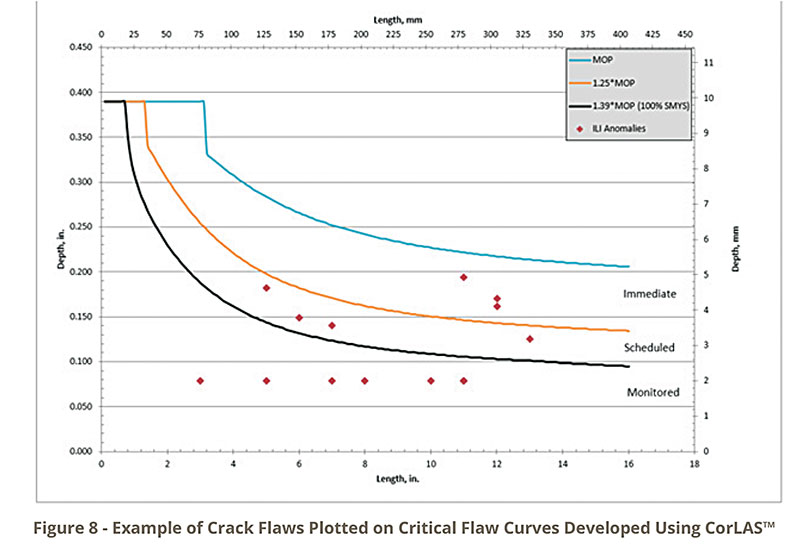
Figure 8 shows an EA example for crack flaw analysis in which a series of critical flaw size curves developed at various pressure levels for crack-like flaws. Fracture mechanics approaches and tools such as CorLAS12 or modified Ln-secant13 are typically used for assessing stress corrosion cracking (SCC) flaws.
Plotting the features as detected from ILI (e.g., liquid coupled ultrasonic on liquids pipelines or electromagnetic acoustic transducer [EMAT] on gas pipelines) demonstrates the criticality of the flaws. Analysis and discussion can then be built around which of these flaws have been remediated or are scheduled for remediation to ensure that an appropriate margin of safety is maintained (i.e., immediate, scheduled or monitored responses required).
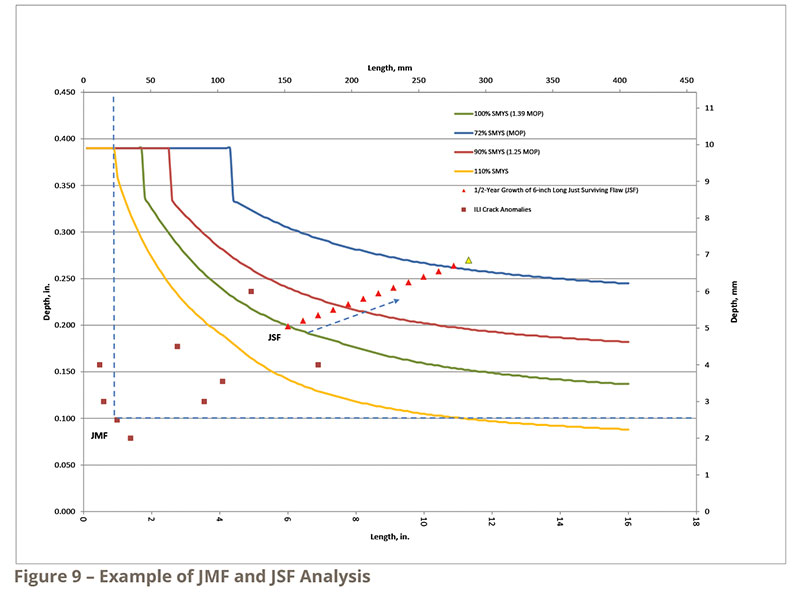
Like the EA example for crack flaw analysis in Figure 8, a series of critical flaw size curves developed at various pressure levels for crack-like flaws (Figure 9). However, in this analysis, we are looking at the potential fitness-for-service impacts from hypothetical “just missed flaws” (JMF) that are below the ILI tool reporting threshold and may have existed at some previous factor of MAOP (e.g., such as at a 1.39 x MAOP hydrostatic pressure test).
Hypothetical flaws that are just below or to the left of the dashed line are considered JMP, which may not be reported by the ILI tool and need to be considered (along with the potential for their growth) when assessing fitness-for-service and safe reinspection intervals.
Also, hypothetical flaws of close to critical size that could have “just survived” a hydrostatic pressure test or a previous, higher operating pressure also need consideration as part of an EA (along with the potential for their growth) when assessing fitness-for-service and safe reinspection intervals.
Criticality of other flaws for various pressure levels with respect to MAOP (represented as maximum operating pressure [MOP] in the figure) can similarly be assessed relative to these curves along with their potential for growing to critical size at MAOP.
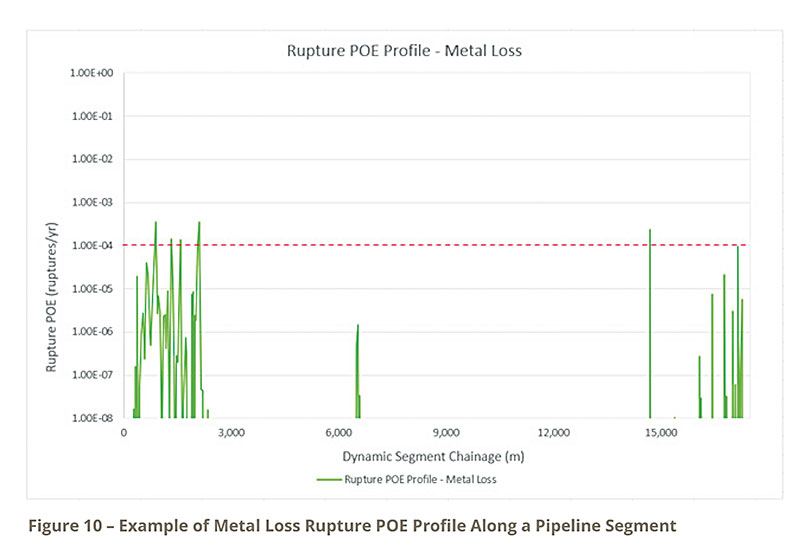
To provide a comprehensive view of threats, it is useful to incorporate both deterministic and reliability-based analyses in the EA. In the EA example for probabilistic (probability of exceedance [POE]) corrosion analysis (Figure 10), the probability of exceeding a limit state is determined for each pipe joint along the line segment based on remaining metal loss features in each pipe joint as determined from the most recent MFL ILI.
In this example, the limit state is equivalent to MAOP ≥ estimated failure pressure. Like the deterministic corrosion analysis example presented earlier, the feature severities and margins of safety along the pipeline segment are made apparent through the POE profile as plotted against an acceptance threshold. This example demonstrates a pipe joint-specific reliability threshold of 1 x 10-04 ruptures/year.14
The application of growth analysis (such as from run comparison of consecutive MFL ILI surveys) to features since time of inspection allows for an assessment of remaining margins of safety with respect to the reliability threshold at both the current time and up to the future time of the next planned reinspection as features grow toward the reliability threshold.
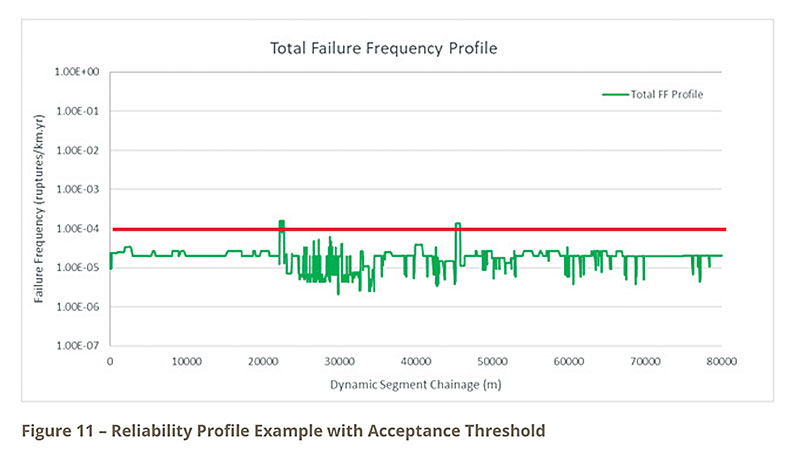
From a risk and reliability analysis perspective, in the example shown in Figure 11, the total reliability profile along the pipeline segment (considering all threats) is demonstrated against an acceptance target of 1 x 10⁻⁴ ruptures/km-year.15
Areas where the target is exceeded can be explored in further detail to understand threat drivers, consequence impacts, mitigation opportunities and the overall risk profile.
Probabilistic reliability approaches provide an opportunity for considering uncertainties in the assessment. Specifically, a risk assessment can provide a valuable, additional analysis layer that further informs the EA. (Canadian Standards Association [CSA] Z662 requires this.) Quantitative and probabilistic risk or reliability results are not always widely understood in terms of acceptability. To demonstrate safety and fitness-for-service to stakeholders, a clearer picture emerges if you can show how your risk levels satisfy accepted risk criteria.
Earlier in this paper, we saw how such criteria are proposed to be included in CSA Z662:23, and Pipeline Hazardous Materials and Safety Administration (PHMSA) has also published reference risk acceptance criteria in a study from other worldwide jurisdictions that could be leveraged.
Alternatively, particularly in the case of class location designation changes, a comparative risk analysis to that of a new replacement pipeline can be effective in demonstrating the safety and fitness-for-service levels compared to a replacement alternative.
Conclusion
Results of the EA or ECA provide for a documented condition summary regarding the pipeline’s fitness-for-service. One must be prepared to potentially discover integrity issues and maintain a mindset of continuous improvement during the EA process. There are no foregone conclusions, and additional actions may be required to ensure pipeline safety.
The goal is for the EA to have demonstrated and documented fitness-for-service for the pipeline at MAOP. This then becomes the proven safety basis for communications with stakeholders going forward. Following is the value summary for effective EAs:
- Focus resources on efforts that measurably increase safety and reliability performance.
- Avoid huge costs for replacement, pressure reductions and pressure testing on pipe that is otherwise fit-for-service.
- Consistent, repeatable approaches (technical building blocks and programs) are developed that can easily integrate and aggregate into solutions for more complex compliance and technical circumstances.
- Strategic frameworks built around emerging regulatory and standards developments in the U.S. and Canada are leveraged for building successful EAs that demonstrate pipeline safety.
References:
- 49 Code of Federal Regulations (CFR) Part 192 – Transportation of Natural and Other Gas by Pipeline: Minimum Federal Safety Standards.
- Part 1 of Gas Mega Rule: Department of Transportation (DOT) Pipeline Hazardous Materials and Safety Administration (PHMSA) Pipeline Safety: Safety of Gas Transmission Pipelines: MAOP Reconfirmation, Expansion of Assessment Requirements, and Other Related Amendments. Revisions to 49 Code of Federal Regulations (CFR) Part 192 to improve the safety of onshore gas transmission pipelines effective July 1, 2020.
- Canadian Standards Association (CSA) Z662:19 Standard – Oil and Gas Pipeline Systems.
- U.S. Department of Transportation (DOT) Pipeline Hazardous Materials and Safety Administration (PHMSA) Final Report No. 16-092 – Paper Study on Risk Tolerance, June 30, 2016.
- NACE SP0102-2017, In-Line Inspection of Pipelines.
- American Petroleum Institute (API) Standard 1163 – In-line Inspection Systems Qualification, Second Edition, April 2013; Reaffirmed, August 2018.
Editor’s note: Presented at the 34th Pipeline Pigging & Integrity Management Conference, Jan. 31 - Feb. 4, 2022. © Clarion Technical Conferences and Great Southern Press. Used with permission.

Comments