
April 2021, Vol. 248, No. 4
Features
Diagnostic in Bidirectional Prover - An Innovative Approach
By Chandulal N. Bhatasana, Saudi Aramco, Dhahran, Kingdom of Saudi
It is important to accurately measure hydrocarbon commodities transferred through pipelines or marine terminals to maximize revenue generation at the point where the ownership of the commodity is transferred.
Therefore, it is essential to quantify and adjust for the performance of flow meters, such as turbine meters, ultrasonic meters, Coriolis meters, etc., for the variations in characteristic of fluid, operating process conditions, etc.
It is well established in the custody/allocation industry to use a meter prover that provides an actionable corrective meter factor (MF) to facilitate defensible and traceable measurement. One of the common types of prover used in the industry is sphere pipe prover. A typical sphere prover has a length of pipe through which a sphere travels, displacing liquid between two points known as a calibration section.
The totalized flow meter volume reading during the time required for the sphere to travel between the detecting points is compared with the known volume of the calibration section, also known as the base prover volume (BPV), to provide accurate calibration data or establish a meter correction factor.
Therefore, a single pair of detector switches is required, at the minimum, in sphere provers to calculate the meter factor (MF) of the flow meter.
A second pair of detector switches may be added to have redundant base prover volumes. With the addition of a second pair of detector switches, four measurements of base prover volumes can be obtained.
Diagnostic Information
This article describes a method to derive and apply diagnostic information to identity the operation status of detector switches, quantify the potential shift/bias in the base prover volume (BPV) and drive performance-based prover recalibration requirements.
The described method is based on two pairs of detector switches in a bidirectional prover. This approach can be extended and applied to proving systems with more than two pairs of detector switches, and also to unidirectional sphere provers or piston type provers.
Proving System
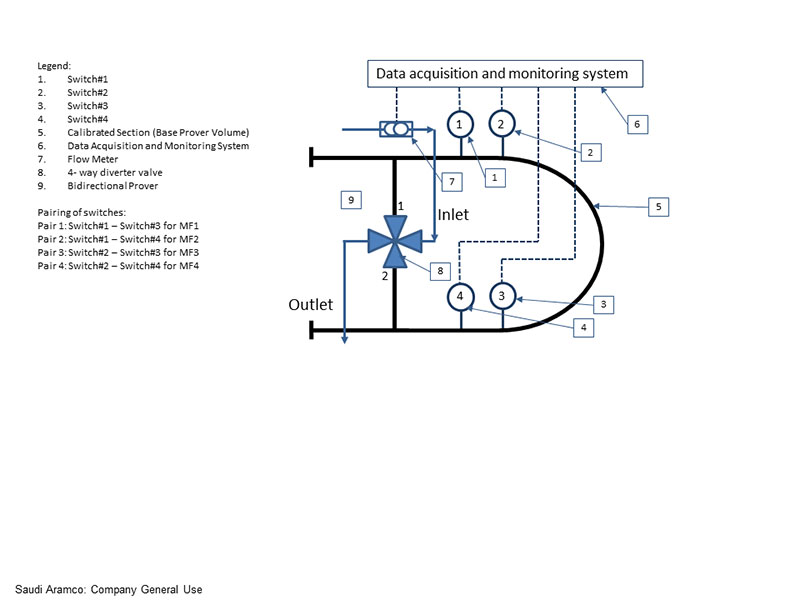
The schematic (Figure1) illustrates the primary setup and components of a typical bidirectional proving system for which diagnostic information can be derived, based on the approach described. (Figure 1)
The process fluid passes through the flow meter (7), enters the bidirectional prover (9) at the inlet port of the four-way diverter valve (8). Depending on the forward or reverse seating position of the valve, the fluid from the port inlet is either diverted to port 1 to the prover calibration section (5) and returns to Port 2 from the prover calibration section (5) or vice versa.
When the four-way diverter valve is seated fully in the forward position, all the process fluid entering at the inlet port is diverted toward the calibrated section through Port 1. The process fluid generates momentum displacing the sphere in the prover pipe. When the sphere arrives at the detector switch #1, it actuates the detector switch that generates an electrical signal to the data acquisition and control system (6) indicating the position of the sphere.
At this instant, the data acquisition and control system starts two separate pulse counters, say C1 and C2. Subsequently, when the sphere hits the detector switch #2, the data acquisition and control system starts, two other pulse counters, say C3 and C4. When the sphere is displaced between detector switch#2 and detector switch #3, four different pulse counters would accumulate the number of pulses generated by the flow meter.
When the sphere hits the detector switch #3, the data acquisition and control system stops counters C1 and C3. As the sphere is displaced further, it actuates the detector switch #4, then the data acquisition and control system stops counters C2 and C4.
Once this forward pass is completed, the position of a four-way diverter valve is changed to reverse. In the reverse pass, the process fluid is diverted towards the calibrated section through Port 2. The process of pulse counting in the forward pass would be repeated during the reverse pass.
The number of flow meter pulses counted by four counters C1, C2, C3 and C4 in the forward and reverse pass are used to calculate four different meter factors MF1, MF2, MF3 and MF4 respectively. The process of deriving the meter factor is repeated multiple times, generally five times. The meter factors are accepted if they repeat within a set limit, general guidelines recommend a repeatability within 0.05%.
Four different meter factors (MF) are calculated as follows with four/two pairs of detector switches:
Pair 1: Switch #1- Switch #3, BPV1 :MF1
Pair 2: Switch #1- Switch #4, BPV2 :MF2
Pair 3: Switch #2- Switch #3, BPV3 :MF3
Pair 4: Switch #2- Switch #4, BPV4 :MF4
Meter factors are not calculated for volumes between switches 1-2 and 3-4 due to proximity and thus significantly low resolution.
Other Considerations
One MF out of the four calculated MFs can be designed for official use. But all four MFs are used to derive diagnostic information related to the prover.
For the purpose of the approach described in this paper, the location of detector switches should be based on following considerations:
- The distance between Switch #2 and Switch #3 is sufficient enough to collect 10000 pulses from flow meter during each proving pass if the pulse interpolation is not used.
- The distance between Switch #2 and Switch #3 complies with the criterion of a minimum distance between detector switches, as defined in API MPMS, Chapter 4.2.
The diagnostic information can be derived by analyzing the four (4) generated MFs.
Prover BPV verification: It is common in the industry to recalibrate the prover and generate a revised prover base volume if one or more detector switches are repaired or replaced. This can be mitigated by comparing ratios of the four MFs after replacement of switches with the ratio of MFs before the repair/replacement.
The comparison will highlight if the BPV has changed or remained the same. If the BPV changed, the changed volume can be estimated.
Normally the average of ratio MF1 to MF4 (say X), MF2 to MF3 (say Y), MF1 to MF2 (say Z) and MF3 to MF4 (say W) should be constant, within a repeatability criterion, and close to a value of one. The data acquisition and monitoring system constantly calculates and records values of these ratios.
After repair/replacement of a detector switch, if the average value of X and Y are not changed or found to be within repeatability criteria, it can be concluded that the BPV has not changed due to the repair/replacement of the detector switch.
Any change in the value of X and proportional change in the value of Y would indicate a corresponding change in the BPV. The value of either Z or W will change proportionally.
For example, if switch#1 is replaced and the value of X increases by 2%, it would indicate the BPV for switch pair 1 (Switch #1-Switch #3) has increased by 2%. This change in BPV shall be visible with a similar change in the value of Y too, but the value of W will remain unchanged.
This feature can be expanded to estimate the new value of BPV when a detector switch was replaced/repaired. Simplistic Eq. (1) uses known BPV between other pairs of detector switches and the ratio of pulses. It may be noted that correction factors for the effect of pressure and temperature on the liquid and prover steel would be canceled out.
----------------Eq. (1)
Where,
BPVd = Base Prover Volume to be derived
BPVk = Known Base Prover Volume between another pair of detector switches
Nd = Number of meter pulses between detector switches for which BPV is to be derived
Nk = Number of meter pulses between detector switches with known BPV
Faulty Detector Switch: Diagnostic information can be derived from the four MFs to indicate a possible failure in the flow meter or the prover detector switches as follows:
- If the repeatability of all four MFs are within acceptable limits, it can be stated that the flow meter and the detector switches are healthy and generating defensible volume calculations.
- If the repeatability of all four MFs are within acceptable limits, however a deviation of all four MFs with respect to previous MFs is observed. This indicates no failure on the proving operation and indicates less uncertainty in the calculated MF.
- If the repeatability of all calculated four MFs are not within acceptable limits, it can be stated that the flow meter could be faulty and not repeatable. This is derived from the assumption that it is very unlikely that three switches or two switches on any one side of the prover (Switch 1- 2 OR Switch #3-#4) can fail simultaneously.
- If two MFs are repeatable within acceptable limits, and repeatability of the other two MFs is beyond acceptance limit, it may be derived that the common detector switch for the nonrepeatable MFs is faulty.
For example:
- If MF3 and MF4 are repeatable, but MF1 and MF2 are not, probably detector Switch #1 is faulty
- If MF1 and MF2 are repeatable, but MF3 and MF4 are not, probably detector Switch #2 is faulty
- If MF2 and MF4 are repeatable, but MF1 and MF3 are not, probably detector Switch #3 is faulty
- If MF1 and MF3 are repeatable, but MF2 and MF4 are not, probably detector Switch #4 is faulty
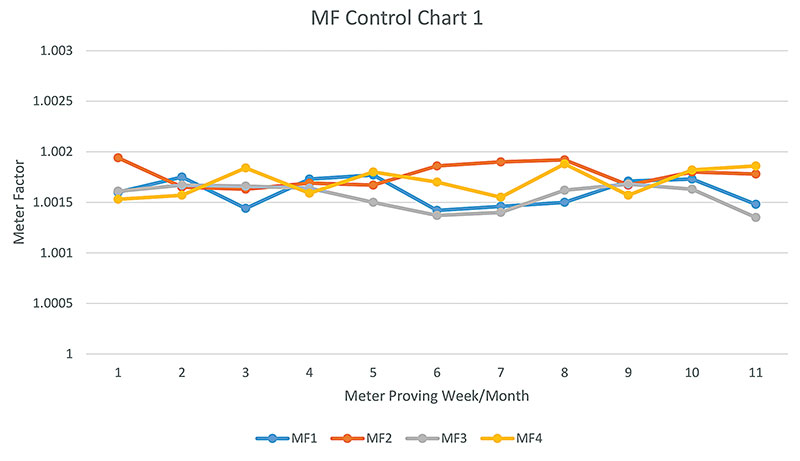
Inconsistent BPV: Ideally, the value of all four MFs (MF1, MF2, MF3, MF4) should be as close as possible to a value of 1 indicating the meter and prover volume are identical. Furthermore, they would trend in a fashion similar to what is displayed in the MF Control Chart 1.
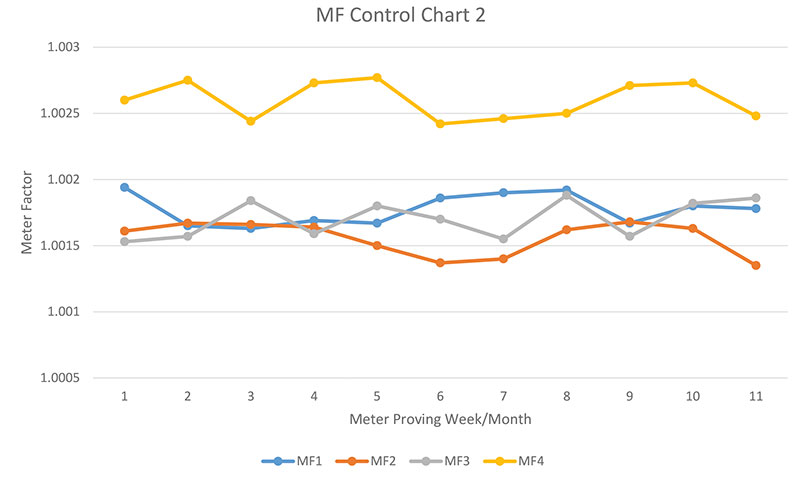
When a repeatable and consistent disparity of any one MF with the other three MFs as shown in MF Control Chart 2, would indicate that the value of BPV associated with the pair of detector switches that generated the MF is not consistent with the other three BPVs.
Repeatable Shift in MF: The running average of MFs (MF1, MF2, MF3, and MF4) ideally should be similar and follow the same trend for the given process fluid within a specific operating process range.
If the running average of all MFs changes gradually to one direction – for example an increase in MFs is observed, particularly for all flow meters in the metering skid – this would indicate that the actual volume between the detector switches is reduced.
This can be associated with possible buildup of waxy/sticky material inside the prover calibration section. Similarly, if the running average of all MFs are decreasing, this would probably indicate that the actual volume between the detector switches increased due to potential wear or erosion.
Sudden Shift in MF: If the running average of two MFs shifted suddenly, this would probably indicate that the actuation point of a common detector switch has changed, resulting in a shift of the actual prover base volume associated with the subject detector switch.
Conclusion
This article described an approach to derive potential diagnostic information using multiple meter factors. Using this diagnostic information, the user can isolate and identify the potential cause that may lead to unsatisfactory proving operation.
Considering the criticality of proving systems, a prover recalibration is performed to obtain a new base prove volume after repair/replacement of detector switches. The prover recalibration process is complex and time consuming. Also, during the period of prover recalibration, flow meters in operation cannot be proved, resulting in less confidence in transferred volume.
Using method described in this paper, it is possible to derive actionable information related to a change in the base Prover Volume by using simplistic Eq-1. The new calculated Base Prover Volume is statistically accurate, facilitating possible avoidance of costly prover recalibration and the associated operation down time.
Disclaimer: The suggestions and guidelines provided in this article should be considered general in nature. Readers are encouraged to refer to relevant codes and standards by legal metrology and other institutes.
References
API MPMS Chap 4 Section 2: Proving Systems, Displacement Provers
API MPMS Chap 4 Section 8: Operation of Proving Systems
API MPMS Chap 12 Section 2: Calculation of Petroleum Quantities Using Dynamic Measurement Methods and Volumetric Correction Factors
Author: Chandulal N. Bhatasana, holds a bachelor’s degree in engineering and has 25-plus years of experience in custody/fiscal metering and instrumentation. He is the chairman of the Custody Measurement Standards Committee in Saudi Aramco. He has written several papers and received granted patents on innovative techniques related to proving systems in custody metering.

Comments