
July 2018, Vol. 245, No. 7
Features
Real-Time Views of Measurement for Performing Data Analytics
By Russel Treat, CEO, EnerSys Corporation
As the CEO of a software company that provides technology and tools to support pipeline operators, I hear a lot of chatter about data analytics. Everyone wants access to the latest data at their fingertips – to be more efficient, run safely, save money, and remain compliant.
However, some operators are looking at the chasm between data and analytics, and are wondering how to build a bridge from data to the effective use of analytics.
Real-time views create meaning and context for the data, benefiting everyone in your operation. Also, real-time views provide information about the process – or, said another way – information about the quality of the measurement.
You might be saying to yourself, “I already collect data in my SCADA system, so why would I need a real-time measurement system?” The key in answering this question is in understanding who is using the data and for what purpose. While the same data is going into the SCADA system, the real value is the view for measurement.
SCADA is looking at how much flow there is right now. However, measurement is looking at how good and reliable the numbers are and will they line up at the end of the day when I provide end-of-day reports?
Everyone is looking at the same data, but everyone needs different information. Ideally, data is contextualized for each role in the operation such that the view into the information supports their specific decision-making.
The contextualization is how I look at the information. When everyone in your operation has the data properly contextualized for their role, there is a significant impact on each person’s ability to determine what actions are required. When the data is contextualized in real-time, decisions can be made now vs. reactively making decisions after events have passed.
Solving Real Problems
One of the best examples of the value of real-time data in measurement is keeping a history of real-time values such as temperature and differential pressure on an orifice meter.
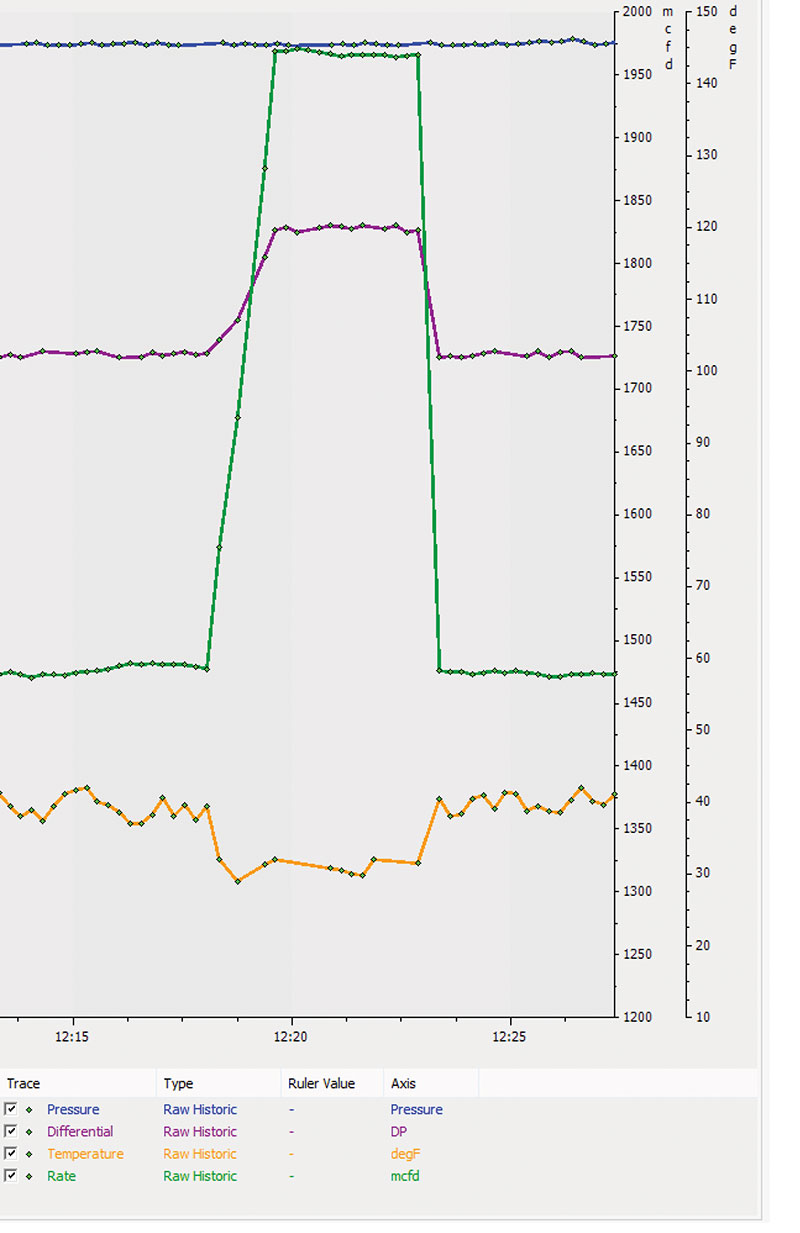
When you look at these values at the one-minute level – or even more frequently – you are provided with a much different view than what an hourly average would typically provide. For example, by trending real-time temperature and differential pressure, you can see a meter freeze occur.
Ultimately, a real-time view of values could be the difference between catching an issue or dealing with it after the fact. Summarized data just is not enough for stakeholders to make optimal decisions.
In the example, the meter occurs and is clear in less than an hour. Typically, the measurement back office is only looking at hourly summarized data. It would be impossible to identify this meter freeze using hourly summary records as the freeze would be buried in the summary.
Here’s another example: Flow computers typically accumulated and summarized measurement into hourly records that are moved back to the measurement back office. This hourly summarized data is critical to the measurement back office function in that it allows for editing and reporting while retaining a measurement audit trail.
However, it is not uncommon in some operations for the measurement data to be collected only once every four hours, or even daily. By the time the measurement office gets that data, the back office could be a day behind in reacting to an alarm. Polling the measurement device for real-time data consumes much less bandwidth than the full hourly audit file and allows for early identification of problems.
Where else can you find much more meaning and context in real-time data compared to summarized data? Consider measurement alarms tied to events in the system.
Again, referring back to the meter freeze, by creating an advanced algorithm using advanced analytics, an algorithm can be created that uses the complete meter condition – temperature, differential pressure, static pressure, composition and moisture content – to calculate when a hydrate would form. This makes a meter freeze notification even more meaningful.
Essentially, your operation needs to follow a six-step process to use data analytics effectively:
- Collect the data in your system.
- Normalize the data in your common structure.
- Use real-time views to find the meaning and context of to the data.
- Perform manual analytics to determine use cases.
- Implement the algorithms to identify abnormal conditions.
- Create a procedure to address the abnormal conditions.
Applying Analytics
Think about the importance of communication in the field. Is it productive for a measurement technician to send an email to the measurement office with his findings on an orifice meter, wait two hours for a response and then take action? Absolutely not. That is entirely inefficient when there are other technological options to speed up the communication process.
Similarly, the key signals coming back from a meter are much more meaningful if both the field and back office can look at them at the same time, discuss the trends and respond accordingly.
For example, a meter freeze will display a typical pattern in its relationship between temperature and differential pressure. When both the field technician and the back office can look at the same pattern, they form a common understanding and define a collaborative path forward to resolve the freeze. Specifically, you should be able to identify when the freeze began and ended. If you are summarizing the data, it becomes much more difficult to see the issue.
Additionally, if you are only seeing the data from a meter freeze at the end of the month, then you must go back through the entire month to edit the data – and you missed an opportunity to react to the meter freeze in real-time.
Conversely, if you have the capability to catch the meter freeze during the month, then you can send a technician out to the meter to clear the freeze, minimizing measurement error and simplifying the end-of-month closing process.
Time Savings
Once you develop and implement a consistent process for using real-time data, you can tap into more methods to use advanced measurement capabilities in the field.
Fortunately, the latest technology available for SCADA systems makes it easier to utilize telemetry to perform real-time measurement functions. A useful example is a gas stream with multiple meters, where the chromatograph is located in such a location that it cannot be shared in the local communications.
For example, at a plant site where inlet meters are remote from the meters at a process inlet, the chromatograph at the plant inlet can be polled and written to the chromatograph at the process inlet. This process eliminates the need to install additional chromatographs, delivering tremendous cost savings.
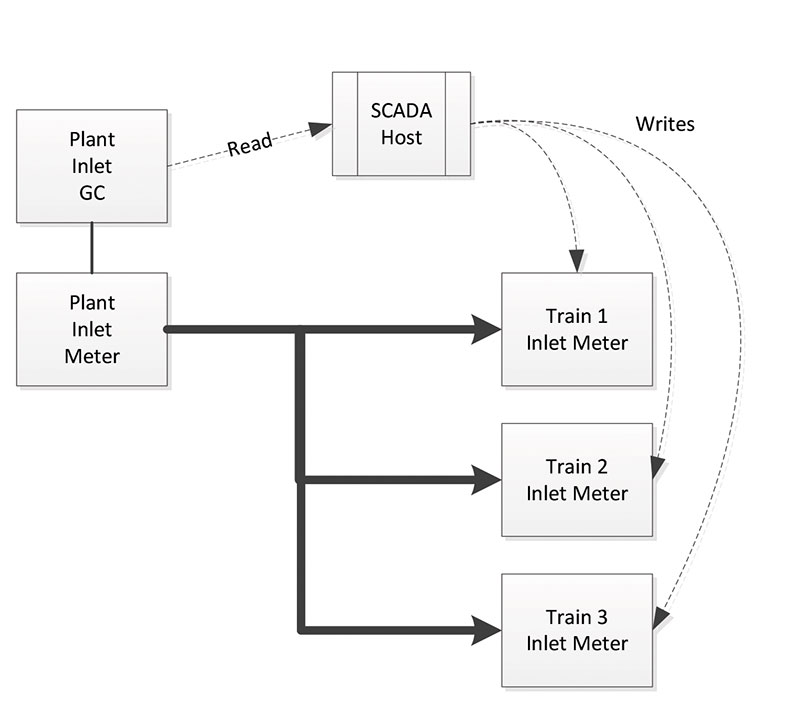
Consider this scenario:
- There are three gas processing trains at the same facility (process inlets), and three different customers making deliveries to the facility (plant inlet).
- Each of the three plant inlets delivers to each of the three train inlets.
- Only the plant inlet meters have an online gas chromatograph (GC), so the plant takes a chromatographic reading at the source and communicates the data to the train inlets.
- Instead of purchasing 12 GCs for each of the train inlets (3-by-4), the plant just needs three GCs at the points of delivery.
Real-time telemetry helps facilitate the plant’s ability to perform accurate measurement. Then, once the data is gathered in real-time, stakeholders in the plant can perform data analytics.
A software tool can help you manage the process of obtaining real-time data, viewing the data and taking action. And, because there is so much measurement data coming into your operation, you also need a tool that can help simplify the process to provide accurate, timely data for operational decision-making.
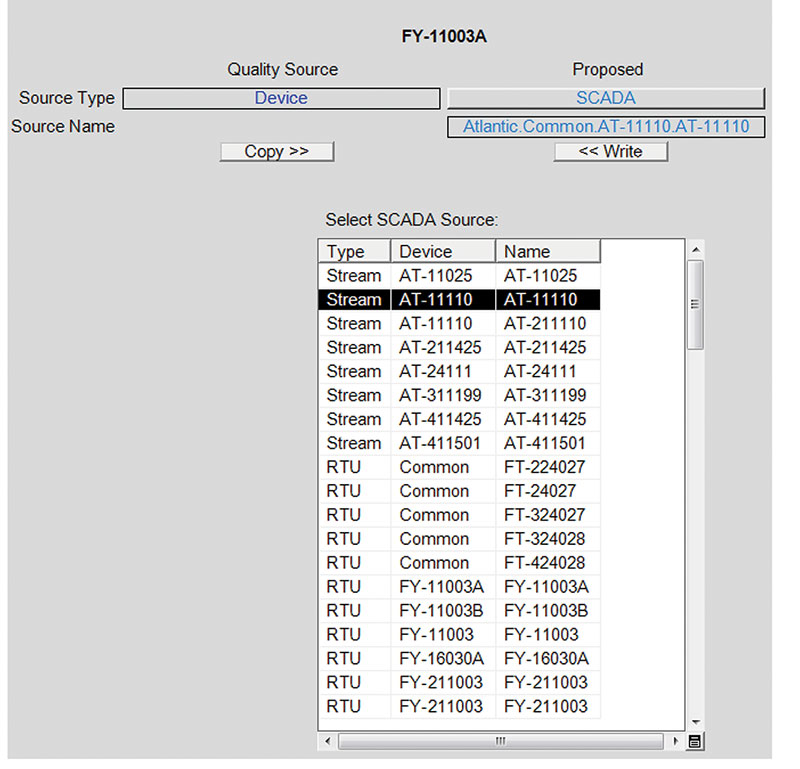
One such tool is the EnerSys IOC intelligent operator console (IOC) for measurement from my company’s POEMS software suite. This tool provides users with real-time access to data from flow computers, PLCs and gas chromatographs.
Using a communication server, the appropriate measurement device is regularly polled to provide operators with real-time data. You can also create a demand poll of a specific device at any time to gather data.
The software is set up to provide multiple views for each stakeholder in the operation. This allows users to perform tasks such as viewing live gas quality from all GCs and reading/writing configurations back to the GC.
We understand the importance of having a central location to collect, view and store the data collected from your measurement devices. That is why our company continues to talk to operators to understand the challenges of moving to real-time data views.
Remember, if the conversation in your pipeline operation is moving toward data analytics, you need to start with how to implement a process for real-time views in metering and measurement. Taking this step will set you on the right path to achieve operational excellence, become more efficient, operate safer, and remain compliant with the latest pipeline regulations. P&GJ

Comments