
December 2021, Vol. 248, No. 12
Features
Safer Operations with Geospatial Analytics
By David Dunham, Satelytics
A customer called recently to enquire about solutions to make routine infrastructure inspection safer for his employees. The reason for the call was sad, but unfortunately, one I had heard before. Staff at the infrastructure for which he was responsible had been conducting the annual aerial surveillance program when a helicopter crashed.
The pilot, an employee of the company, died in the crash. This caller was deeply saddened by the incident and told me it had spurred him to seek a better way to inspect infrastructure and reduce risk to his employees and the public.
Perhaps this is the most dramatic of incidents related to routine inspection of large asset areas, but most operations managers have had personnel injured in the field or have had to deal with a vehicle crash. I learned the hard way that what follows an incident is usually some form of guilt – I felt responsible for my field crews and the risks they encounter.
After that, there was the secondary responsibility of dealing with incident reports, logistical issues and insurance forms. We all care about our people and want to protect them in any way we can.
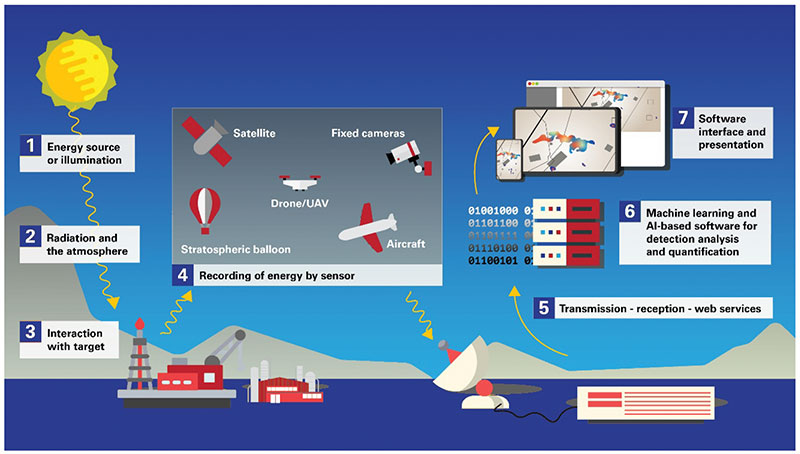
Geospatial analytics has come a long way from its inception in the early 80s. Spatial resolution (the pixel size afforded by the sensor onboard the satellite) was often measured in tens or even hundreds of meters with only a few visible spectrum bands.
Today’s high-resolution satellites can survey each square foot of the entire earth’s surface and can do so daily. They can provide multispectral imagery including visible, near-infrared (NIR), and short-wave infrared (SWIR) wavelengths. Soon to come will be mid-wave infrared bands and even hyperspectral data comprising hundreds of wavelength bands.
The amount of data being gathered over the earth’s surface today is staggering. Petabytes of data are gathered for survey projects of a single midstream company’s asset areas. A benefit of satellite-based surveillance is that communications infrastructure exists to handle these enormous data caches.
Surveying thousands of square kilometers in a matter of minutes is routine and nearly instantaneous. In fact, experts predict that satellite imagery will be available every few minutes globally by the late part of the decade!
So, what is possible?
Can high-resolution satellite data coupled with science-based analytics replace the pilot in an airplane or helicopter?
Can actionable results be handed to the asset manager quickly enough to get out ahead of threats and prevent consequences?
Similar to DNA
Spectral measurement algorithms operate in the infrared bands to detect and, in many cases, quantify constituents in parts per million (ppm) to parts per trillion (ppt) concentrations on water, land and in air. Quantification also means that vegetation speciation, health and density are possible.
This capability is akin to performing spectroscopy, but instead of in a lab on a small sample, measurements are completed using sensors on a satellite over land and water assets. The sensor provides a spectral “data packet” for every pixel over the entire area of interest.
The pixels are laid out in a grid over the earth’s surface. With more pixels, the picture becomes clearer and more specific. This is very similar to the incredible advancement in resolution in television screens, from the grainy, black-and-white screens we used in my younger years to today’s 8K versions that allow one to see vibrant colors and follow them in even the fastest paced sports.
A spectral signature is like human DNA. What sets someone from an Irish heritage (me) apart from someone with a German heritage (my wife) is encoded in our unique DNA. Similarly, the spectral signature of an oak tree is different from that of a maple tree and a gray pine is different than a white pine. Chemical signatures of liquid hydrocarbons reflect sunlight in a manner distinct from that of produced water or of a methane plume. Signatures can also be interpreted for metals, other chemicals and microbiological species.
Quantification is the proverbial icing on the cake for geospatial analytics, but it is often the more “mundane” capabilities that provide value in the areas of threat reduction and asset protection. For change detection, vegetation management, and land movements, objects and features as small as 1 square foot can be identified. On the other hand, lower-resolution imagery (greater than 3-meter pixels) provides adequate data for land classification projects.
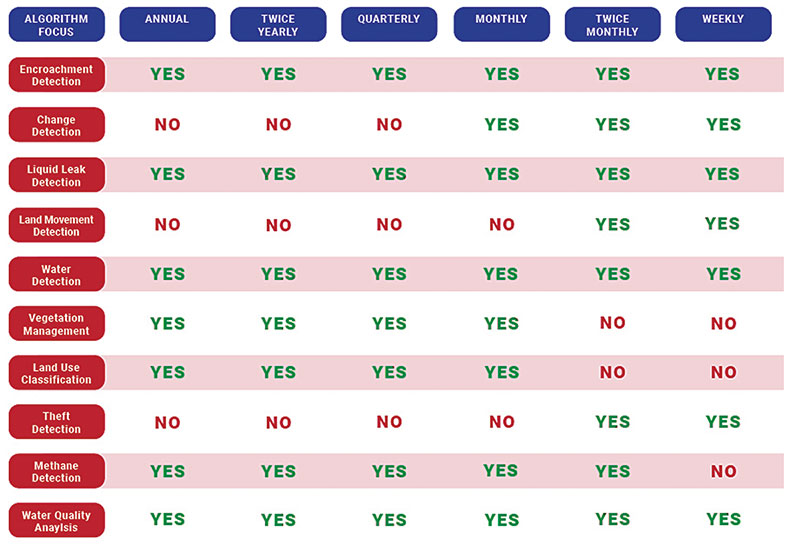
Observation Frequency
An important decision when transitioning from aerial to satellite observation is observation frequency. Large midstream infrastructure owners sometimes monitor entire areas as often as weekly. Because PHMSA-regulated pipelines require twice-monthly flyovers, that is another often-used frequency option. In transitioning to satellite-based observation, pipeline companies have demonstrated a tendency to start with biannual or quarterly frequency as operations teams adjust to a new set of data and workflow.
Aerial observation typically requires subjective interpretation by human pilots to identify changes to infrastructure that are out of the ordinary. Machine learning and cloud processing of large data sets can automate the survey process. Every pixel is examined every time. Machine learning decides if a change has occurred, whether a constituent like methane or liquid hydrocarbon is present, and quantifies it when detected.
With data analytics and unlimited cloud processing power, the human error associated with repetitive actions and large amounts of information can be removed from the risk profile. This frees infrastructure managers to decide how and when to respond to the threats identified, rather than spending time and effort on finding threats.
As industry becomes more comfortable with geospatial analytics, the frequency of monitoring is increasing and driving down instances of damage and spills. Experts predict that the adoption of satellite monitoring will increase, with supply and demand forces spurring more hardware options that will drive data costs lower. Revisit times will also decrease as more observation hardware options are put in orbit.
A concern frequently expressed by pipeline operators is that encroachments in the pipeline right-of-way are expensive every year. With accurate change detection and rapid analytical results, operators can reduce risk through proactive monitoring for vehicles, agricultural activities, construction, erosion, and digging, and tie each back to a specific latitude and longitude of the intrusion. Operators achieve efficiency by sending response personnel only to locations needing their expert attention.
Another top priority for pipeline operators is the detection of liquid hydrocarbon leaks. Since regulation and the court of public opinion are increasingly pressuring the industry toward a zero-incident future, companies are looking to add another layer of protection to their networks.
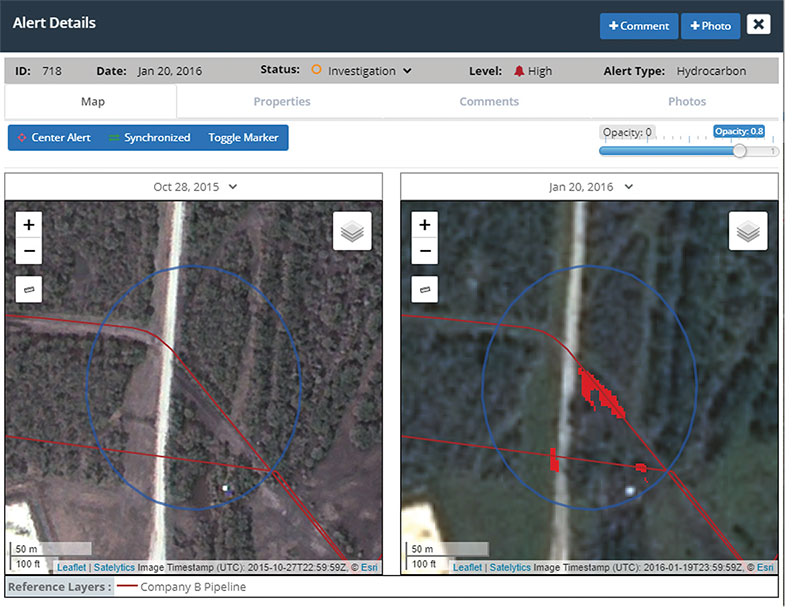
Geospatial analytics can offer something that supervisory control and data acquisition (SCADA) systems cannot – a look outside the pipe at coming threats as well as detection of very small subsurface leaks missed by SCADA and computational methods. Although passive satellite detection of hydrocarbons cannot see subsurface, identification of leaks through surrogates like vegetation health has proven to be very useful.
Because hydrocarbon uptake occurs in root systems, even in minuscule amounts, the spectral change can be identified. Even leaky gas pipes that might be carrying small amounts of condensates have been identified through vegetation chlorosis.
Although liquid hydrocarbons have been the primary interest, identification of brine leaks is important for our midstream customers that transport produced water in their gathering and disposal well networks.
Passive satellite monitoring is also proving useful in the identification and prediction of geohazards and land movements. Monitoring for these concerns is often timed to seasonal changes like snowmelt, rainy periods or wildfires, where slope subsidence and loss of vegetative cover occur.
With every pixel examined (each pixel as small as one square foot, the size of a dinner plate), an accurate digital elevation model and other results are ready for viewing a few hours after satellite overpass. Thus, movements can be identified before they become disasters.
A third primary topic of interest for the midstream industry is vegetation conditions in the pipeline ROW. With spectral analysis, vegetation speciation, health, moisture, growth and decline can be identified to ensure buried infrastructure remains that way.
Pipeline construction projects are often tied to the restoration of excavations to a natural state, with bond payments released only after vegetation is thriving again. Some operators realize a cost reduction of insurance premiums as they commit to increased use of advanced geospatial analytics.
Minimizing Risk
Safety is a predominant topic. It refers to employees, the public, and the safe operation of large logistics networks. Upon reviewing Satelytics options, one of our customers who runs a large gas operation in Colorado recently commented, “We drive 69 million miles per year, each mile is a risk to personnel, property, and its consequences. This is 69 million more than we wish to drive each year. Any reduction in risk most definitely has my attention.”
Is there a better way of managing your assets to reduce risk? Perhaps satellite monitoring coupled with science-backed analytics can catapult your safety program light years ahead of the competition.
Author: David Dunham is a business development engineer at Satelytics, a cloud-based geospatial analytics software suite.

Comments